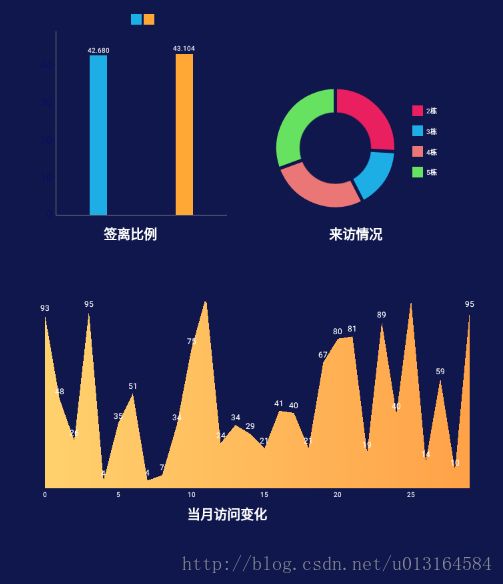
Android柱状图、饼状图、折线图
1、效果图
2、代码
1)compile ‘com.github.PhilJay:MPAndroidChart:v3.0.1’
2)柱状图
 <com.github.mikephil.charting.charts.BarChart
        android:id="@+id/chart1"
        android:layout_width="300dp"
        android:layout_height="320dp" />
String[] mDatas = new String[] {"未签离", "已签离"};
PieChart mPChart = (PieChart) findViewById(R.id.piechart1);
private void initData1() {
mChart.setDrawBarShadow(false);//绘制当前展示的内容顶部阴影
mChart.setDrawValueAboveBar(true);//柱状图上面的数值是否在柱子上面
mChart.getDescription().setEnabled(false);//是否显示柱状图详情
mChart.setMaxVisibleValueCount(60);//Y方向的最大值.
mChart.setPinchZoom(false);//双指缩放.
mChart.setDrawGridBackground(false);//绘制中心内容区域背景色
mChart.setTouchEnabled(false);//设置不可以触摸
// mChart.setGridBackgroundColor(R.color.color_transparent);
mChart.getXAxis().setGridLineWidth(10f);//X轴上的刻度竖线的宽
XAxis xAxis = mChart.getXAxis();//获得x坐标
xAxis.setDrawLabels(true);//是否显示x轴上的数值
xAxis.setDrawGridLines(false);//是否显示竖直标尺线
xAxis.setPosition(XAxis.XAxisPosition.BOTTOM);//设置x坐标的位置
xAxis.setTextColor(Color.TRANSPARENT);//设置x轴上值的颜色
xAxis.setGridColor(R.color.color_transparent); //X轴上的刻度竖线的颜色
xAxis.setValueFormatter(new IAxisValueFormatter() {
@Override
public String getFormattedValue(float value, AxisBase axis) {//设置X轴上值的格式
return String.valueOf((int) value);
}
});
mChart.getAxisRight().setEnabled(false);//是否显示最右侧竖线
YAxis leftAxis = mChart.getAxisLeft();//获得y坐标
//设置y坐标的位置,参数是INSIDE_CHART(Y轴坐标在内部) 或 OUTSIDE_CHART(在外部(默认是这个))
leftAxis.setPosition(YAxis.YAxisLabelPosition.OUTSIDE_CHART);
leftAxis.setSpaceTop(14f);///分割线的间距百分比
leftAxis.setTextColor(R.color.color_transparent);
leftAxis.setTextSize(16f);
leftAxis.setDrawGridLines(false);//是否显示竖直标尺线
leftAxis.setAxisMinimum(0f);//设置y轴最小值
leftAxis.setValueFormatter(new IAxisValueFormatter() {
@Override
public String getFormattedValue(float value, AxisBase axis) {
return Math.round(value) + "";
}
});
Legend l = mChart.getLegend();//得到图例
l.setVerticalAlignment(Legend.LegendVerticalAlignment.TOP);//设置图例位置居中
l.setHorizontalAlignment(Legend.LegendHorizontalAlignment.CENTER);//设置图例位置靠右
l.setOrientation(Legend.LegendOrientation.HORIZONTAL);//设置图例排列竖直显示
l.setDirection(Legend.LegendDirection.LEFT_TO_RIGHT);
l.setXEntrySpace(10f);//设置图例在x轴方向上的间距
l.setYEntrySpace(10f);//设置图例在y轴方向上的间距
l.setForm(Legend.LegendForm.SQUARE);
l.setTextSize(12f);
l.setFormSize(16f);//设置legend的大小
l.setTextColor(Color.WHITE);
setData1(1, 50);
}
private void setData1(int count, float range) {
float start = 1f;
ArrayList yVals1 = new ArrayList();
for (int i = (int) start; i < start + count + 1; i++) {
float mult = (range + 1);
float val = (float) (Math.random() * mult);
yVals1.add(new BarEntry(i, val,mDatas[i % mDatas.length]));
}
BarDataSet set1;
if (mChart.getData() != null &&
mChart.getData().getDataSetCount() > 0) {
set1 = (BarDataSet) mChart.getData().getDataSetByIndex(0);
set1.setValues(yVals1);
mChart.getData().notifyDataChanged();
mChart.notifyDataSetChanged();
} else {
set1 = new BarDataSet(yVals1, "");
set1.setDrawIcons(false);
set1.setColors(ColorTemplate.HORIZONTALZHUCHART_COLORS);
set1.setValueTextSize(12f);
set1.setValueTextColor(Color.WHITE);
ArrayList dataSets = new ArrayList();
dataSets.add(set1);
BarData data = new BarData(dataSets);
data.setValueTextSize(10f);//设置柱状图上值的字体大小
data.setBarWidth(0.2f);//设置柱状图每个柱子的宽度
mChart.setData(data);
}
}
```
2)饼状图
```
<com.github.mikephil.charting.charts.PieChart
android:id="@+id/piechart1"
android:layout_width="260dp"
android:layout_height="260dp"
>com.github.mikephil.charting.charts.PieChart>
```
```
String[] mParties = new String[] {"2栋", "3栋", "4栋", "5栋"};
LineChart mLChart = (LineChart) findViewById(R.id.linechart);
private void initData2() {
mPChart.setUsePercentValues(true);//设置饼图使用百分比
mPChart.getDescription().setEnabled(false);//设置不显示饼图的详情
mPChart.setExtraOffsets(0, 20, 5, 5);//设置图表外,布局内显示的偏移量
mPChart.setDrawHoleEnabled(true); //设置饼图中间空
mPChart.setHoleColor(ColorTemplate.getHoloBg());//设置饼图中间空的颜色
mPChart.setTransparentCircleColor(ColorTemplate.getHoloBg());//设置透明圆的颜色
mPChart.setTransparentCircleRadius(61f);//设置透明圆的半径
mPChart.setTransparentCircleAlpha(110);//设置透明圆的透明度
mPChart.setHoleRadius(60f); //设置中空的圆的半径
mPChart.setDrawCenterText(false);//设置饼图中间是否有文字
mPChart.setRotationEnabled(false);//设置饼图是否可以旋转
mPChart.setHighlightPerTapEnabled(true);//设置为false以防止值由敲击姿态被突出显示。默认值为true。
setData2(4, 100);
mPChart.animateY(0, Easing.EasingOption.EaseInOutQuad);//设置动画速度
Legend l = mPChart.getLegend();//得到饼图图例
l.setVerticalAlignment(Legend.LegendVerticalAlignment.CENTER);//设置饼图位置在中间
l.setHorizontalAlignment(Legend.LegendHorizontalAlignment.RIGHT);//设置饼图位置在右边
l.setOrientation(Legend.LegendOrientation.VERTICAL);//设置饼图图例竖直显示
l.setDrawInside(false);//设置图例在饼图外侧
l.setXEntrySpace(25f);//设置图例在x轴方向上的间距
l.setYEntrySpace(15f);//设置图例在y轴方向上的间距
l.setFormSize(16f);//设置legend的大小
l.setTextColor(Color.WHITE);
l.setYOffset(10f);
}
private void setData2(int count, float range) {
float mult = range;
ArrayList entries = new ArrayList();
for (int i = 0; i < count; i++) {
entries.add(new PieEntry((float) ((Math.random() * mult) + mult / 5),
mParties[i % mParties.length],
null));
}
PieDataSet dataSet = new PieDataSet(entries, "");
dataSet.setDrawIcons(false);
dataSet.setSliceSpace(5f);
dataSet.setIconsOffset(new MPPointF(0, 40));
dataSet.setSelectionShift(9f);
ArrayList colors = new ArrayList();
for (int c : ColorTemplate.MATERIAL_COLORS)
colors.add(c);
colors.add(ColorTemplate.getHoloBlue());
dataSet.setColors(colors);
PieData data = new PieData(dataSet);
data.setValueFormatter(new PercentFormatter());
data.setValueTextSize(11f);
data.setValueTextColor(Color.TRANSPARENT);
mPChart.setDrawSliceText(false);//不显示饼图内元素文字
mPChart.setData(data);
mPChart.highlightValues(null);
mPChart.invalidate();
} 3)折线图
 <com.github.mikephil.charting.charts.LineChart
        android:id="@+id/linechart"
        android:layout_width="680dp"
        android:layout_height="310dp"
        >com.github.mikephil.charting.charts.LineChart>
BarChart mChart = (BarChart) findViewById(R.id.chart1);
private void initData3() {
mLChart.getDescription().setEnabled(false);
mLChart.setTouchEnabled(false);
mLChart.setDragEnabled(false);
mLChart.setScaleEnabled(false);
mLChart.setDrawGridBackground(false);
mLChart.setNoDataText("暂无折线图数据");//如果没有数据的时候,会显示这个
XAxis xAxis = mLChart.getXAxis();//x轴样式
xAxis.setTextColor(Color.WHITE);
xAxis.setDrawAxisLine(false);//是否绘制坐标轴的线,即含有坐标的那条线,默认是true
xAxis.setGridColor(Color.TRANSPARENT);//X轴上的刻度竖线的颜色
xAxis.setPosition(XAxis.XAxisPosition.BOTTOM);
xAxis.setAxisLineColor(Color.TRANSPARENT);
xAxis.setValueFormatter(new IAxisValueFormatter() {
@Override
public String getFormattedValue(float value, AxisBase axis) {
return Math.round(value) + "";
}
});
YAxis leftAxis = mLChart.getAxisLeft();
leftAxis.setTextColor(Color.TRANSPARENT);
leftAxis.setAxisMaximum(100f);//设置y轴的最大值
leftAxis.setAxisMinimum(0f);//设置x轴的最小值
leftAxis.setDrawAxisLine(false);//是否绘制坐标轴的线,即含有坐标的那条线,默认是true
// 隐藏纵横网格线
mLChart.getXAxis().setDrawGridLines(false);
mLChart.getAxisLeft().setDrawGridLines(false);
mLChart.getAxisRight().setDrawGridLines(false);
leftAxis.setAxisLineColor(Color.TRANSPARENT);
leftAxis.setDrawZeroLine(false);
leftAxis.setValueFormatter(new IAxisValueFormatter() {
@Override
public String getFormattedValue(float value, AxisBase axis) {
return Math.round(value) + "";
}
});
mLChart.getAxisRight().setEnabled(false);
Legend mLegend = mLChart.getLegend();
mLegend.setEnabled(false);
setData3(30, 100);
mLChart.animateX(0);
}
private void setData3(int count, float range) {
ArrayList values = new ArrayList();
for (int i = 0; i < count; i++) {
float val = (float) (Math.random() * range) + 3;
values.add(new Entry(i, val, null));
}
LineDataSet set1;
if (mLChart.getData() != null &&
mLChart.getData().getDataSetCount() > 0) {
set1 = (LineDataSet) mLChart.getData().getDataSetByIndex(0);
set1.setValues(values);
mLChart.getData().notifyDataChanged();
mLChart.notifyDataSetChanged();
} else {
set1 = new LineDataSet(values, "");
set1.setDrawIcons(false);
set1.setColor(Color.TRANSPARENT);
set1.setDrawCircles(false);//是否要画折线上的圆
set1.setLineWidth(0f);//线宽度
set1.setFillAlpha(65);//透明度
set1.setValueTextSize(12f);//设置折线上值的字体大小
set1.setCubicIntensity(0.05f);//设置折线平滑度
set1.setValueTextColor(Color.WHITE);
set1.setDrawFilled(true);//折线下是否填充
set1.setFormLineWidth(0f);
set1.setFormSize(16.f);
set1.setFillDrawable(ContextCompat.getDrawable(this, R.drawable.bg_chart_orange));//设置填充的颜色
ArrayList dataSets = new ArrayList();
dataSets.add(set1);
LineData data = new LineData(dataSets);
mLChart.setData(data);
}
} 3、更多
请见博客http://blog.csdn.net/u014136472/article/details/50273309
