小程序wx-charts的项目实用
大家好,我是小九
最近公司的一个小程序项目要用到统计类折线图


于是准备用wx-charts来做这个趋势图
首先从gethub上或者从码云上下载wx-charts.js,传送门:https://gitee.com/Q_Augly/wx-charts.git
打开git地址后我们可以看到wx-charts的一些介绍。
wx-charts是基于canvas用js写的。
支持的图表类型有:
- 饼图 pie
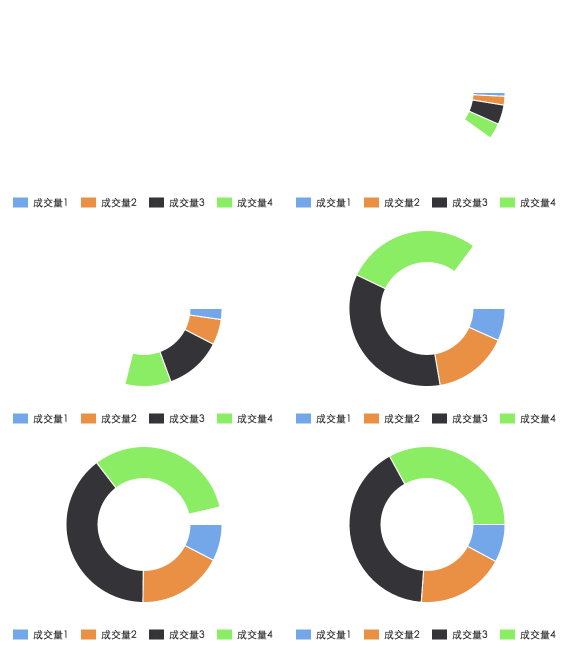
- 圆环图 ring
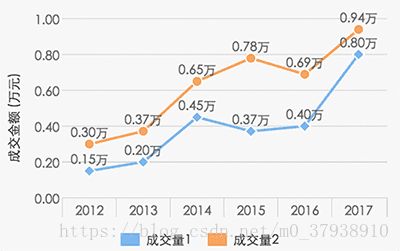
- 线图 line
- 柱状图 column
- 区域图 area
- 雷达图 radar
点击查看代码分析
我们先来看一下例子
参数说明
参数说明-wxCharts文档
方法&事件
方法&事件
具体实现
本文以我自己的项目作为实例,给大家讲解一下
<view class='head'>
  <view class="head_item" bindtap='torecord'>血压记录view>
  <view class='line'>view>
  <view class="head_item head_itemActive">趋势图view>
view>
<view class='mymain'>
  <view class='qs'>
    <view class="container">
      <view class='container_head'>
        <view class='container_head_top'>
          <view class='prev'>
            <text class='iconfont icon-iconfontzhizuobiaozhun023126'>text>
            <text>上一周text>
          view>
          <view class='top_title'>本周6月7日-6月13日view>
          <view class='next'>
            <text>下一周text>
            <text class='iconfont icon-jiantouyou'>text>
          view>
        view>
        <view class='container_head_main'>
          <view>
            <view class='main_Ttitle'>平均血压值view>
            <view class='main_main'>138/80view>
            <view class='main_mintitle'>mmHgview>
          view>
          <view>
            <view class='main_Ttitle'>平均心率值view>
            <view class='main_main'>65view>
            <view class='main_mintitle'>次/分钟view>
          view>
        view>
      view>
      <canvas canvas-id="lineCanvas" disable-scroll="true" class="canvas" bindtouchstart="touchHandler">canvas>
    view>
  view>


view>
wxss:
/* pages/index/lookrecord/lookrecord.wxss */

page {
  background-color: rgba(239, 239, 240, 1);
}

.head_item {
  width: 374rpx;
  text-align: center;
  font-size: 34rpx;
  color: #999;
  letter-spacing: 0;
}

.head_itemActive {
  color: rgba(87, 213, 200, 1);
}

.line {
  width: 2rpx;
  height: 100%;
  background-color: rgba(204, 204, 204, 1);
}

.head {
  width: 100%;
  height: 100rpx;
  background-color: rgba(255, 255, 255, 1);
  border-bottom: 1rpx solid rgba(204, 204, 204, 1);
  display: flex;
  align-items: center;
  justify-content: space-between;
  position: fixed;
  top: 0;
  z-index: 10;
}

.mymain {
  position: absolute;
  width: 100%;
  height: 100%;
  display: block;
  box-sizing: border-box;
  padding-top: 100rpx;
  top: 0;
}

.xyjl {
  width: 100%;
  height: 100%;
  box-sizing: border-box;
  padding: 0rpx 30rpx;
}

.item_title {
  width: 100%;
  height: 91rpx;
  line-height: 90rpx;
  font-size: 26rpx;
  color: #999;
  letter-spacing: 0;
}

.item_main {
  border-radius: 30rpx;
  background-color: rgba(255, 255, 255, 1);
  width: 100%;
  height: auto;
  box-sizing: border-box;
  padding: 0rpx 40rpx;
}

.icon-jiantouyou, .icon-icon_arrow_top, .icon-jiantouxia,
.icon-iconfontzhizuobiaozhun023126 {
  font-size: 30rpx;
  color: rgba(199, 199, 204, 1);
}

.main_title {
  width: 100%;
  height: 250rpx;
  box-sizing: border-box;
  padding: 30rpx 0rpx;
  display: flex;
  align-items: center;
  justify-content: space-between;
}

.main_item {
  width: 100%;
  height: 200rpx;
  box-sizing: border-box;
  padding: 30rpx 0rpx;
  display: flex;
  align-items: center;
  justify-content: space-between;
  border-top: 1rpx solid rgba(216, 216, 216, 1);
}

.title_kind {
  width: 150rpx;
  height: 100%;
  display: flex;
  flex-direction: column;
  justify-content: space-between;
  align-items: center;
}

.kind_title {
  font-size: 26rpx;
  color: #333;
  text-align: center;
  line-height: 30rpx;
}

.kind_number {
  font-size: 34rpx;
  color: #d63030;
  letter-spacing: 0;
  line-height: 45rpx;
}

.kind_numberSussece {
  color: rgba(99, 218, 121, 1);
}

.kind_dw {
  font-size: 26rpx;
  color: #333;
  line-height: 45rpx;
}

.kind_result {
  display: inline-block;
  height: 45rpx;
  padding: 0rpx 20rpx;
  border: 2rpx solid #e68a8a;
  border-radius: 100rpx;
  font-size: 26rpx;
  color: #d73737;
  line-height: 40rpx;
}

.kind_resultSuccess {
  border: 2rpx solid rgba(99, 218, 121, 1);
  color: rgba(99, 218, 121, 1);
}

.qs {
  width: 100%;
  height: 100%;
  box-sizing: border-box;
  padding-top: 80rpx;
}

.container {
  width: 690rpx;
  border-radius: 30rpx;
  background-color: rgba(255, 255, 255, 1);
  height: 950rpx;
  display: flex;
  flex-direction: column;
  box-sizing: border-box;
  font-size: 35rpx;
  color: #333;
  margin: 0 auto;
}

.container_head {
  width: 640rpx;
  margin: 0 auto;
  height: auto;
}

.container_head_top {
  width: 100%;
  height: 100rpx;
  border-bottom: 1rpx solid rgba(216, 216, 216, 1);
  display: flex;
  align-items: center;
  justify-content: space-between;
}

.canvas {
  width: 100%;
  height: 550rpx;
  margin-top: 30rpx;
}

.prev, .next {
  width: 130rpx;
  border-radius: 100rpx;
  display: flex;
  justify-content: space-between;
  font-size: 24rpx;
  align-items: center;
  color: #fff;
  box-sizing: border-box;
  padding: 3rpx 15rpx 0rpx 15rpx;
  line-height: 50rpx;
  background-color: rgba(87, 213, 200, 1);
}

.prev text {
  display: block;
}

.next text {
  display: block;
}

.iconfont {
  font-size: 20rpx;
  color: #fff;
}

.top_title {
  font-size: 26rpx;
  color: #333;
}

.container_head_main {
  width: 100%;
  height: 170rpx;
  display: flex;
  align-items: center;
  justify-content: space-between;
  border-bottom: 1rpx solid rgba(216, 216, 216, 1);
}

.container_head_main view {
  width: 50%;
  display: flex;
  flex-direction: column;
  justify-content: center;
  align-items: center;
}

.main_Ttitle {
  font-size: 26rpx;
  color: #333;
  text-align: center;
  line-height: 50rpx;
}

.main_main {
  font-size: 34rpx;
  color: #333;
  text-align: center;
  font-weight: bold;
  line-height: 40rpx;
}

.main_mintitle {
  font-size: 26rpx;
  color: #333;
  text-align: center;
  line-height: 50rpx;
}
开始写js
js文件:
// pages/index/lookrecord/lookrecord.js
var wxCharts = require('../../../utils/wxcharts.js');   //引入wxChart文件
var app = getApp();
var lineChart = null;
Page({

  /**
   * 页面的初始数据
   */
  data: {

  },

  torecord() {
    // wx.navigateTo({
    //   url: '../lookrecord/lookrecord',
    // })
    wx.navigateBack({
      delta: 1,
    })
  },
  touchHandler: function (e) {
    lineChart.showToolTip(e, {
      // background: '#7cb5ec',
      format: function (item, category) {
        return category + ' ' + item.name + ':' + item.data
      }
    });
  },
  // createSimulationData: function () {
  //   var categories = [];
  //   var data = [];
  //   for (var i = 6; i > 0; i--) {
  //     categories.unshift('2018-' + (i + 1));
  //     data.push(Math.random() * (20 - 10) + 10);
  //   }
  //   // data[4] = null;
  //   return {
  //     categories: categories,
  //     data: data
  //   }
  // },
  updateData: function (e) {
    // var simulationData = this.createSimulationData();
    // var series = [{
    //   name: '成交量1',
    //   data: simulationData.data,
    //   format: function (val, name) {
    //     return val.toFixed(2) + '万';
    //   }
    // }];
    // lineChart.updateData({
    //   categories: simulationData.categories,
    //   series: series
    // });
  },


  /**
   * 生命周期函数--监听页面加载
   */
  onLoad: function (e) {
    var windowWidth = '', windowHeight='';    //定义宽高
    try {
      var res = wx.getSystemInfoSync();    //试图获取屏幕宽高数据
      windowWidth = res.windowWidth / 750 * 690;   //以设计图750为主进行比例算换
      windowHeight = res.windowWidth / 750 * 550    //以设计图750为主进行比例算换
    } catch (e) {
      console.error('getSystemInfoSync failed!');   //如果获取失败
    }
    lineChart = new wxCharts({     //定义一个wxCharts图表实例
      canvasId: 'lineCanvas',     //输入wxml中canvas的id
      type: 'line',       //图标展示的类型有:'line','pie','column','area','ring','radar'
      categories: ['2018-6-13', '2018-6-14', '2018-6-15', '2018-6-16', '2018-6-17', '2018-6-18', '2018-6-19'],    //模拟的x轴横坐标参数
      animation: true,  //是否开启动画
      series: [{   //具体坐标数据
        name: '收缩压',  //名字
        data: [60,90, 60, 110,120,105,70],  //数据点
        format: function (val, name) {  //点击显示的数据注释
          return val + 'mmHg';
        }
      }, {
        name: '舒张压',
        data: [50, 100, 80, 115, 120, 90, 125],
        format: function (val, name) {
          return val + 'mmHg';
        }
      }, {
        name: '心率',
        data: [60, 70, 90, 105, 120, 130, 95],
        format: function (val, name) {
          return val + '次/分钟';
        }
      }
      ],
      xAxis: {   //是否隐藏x轴分割线
        disableGrid: true,
      },
      yAxis: {      //y轴数据
        title: '数值',  //标题
        format: function (val) {  //返回数值
          return val.toFixed(2);
        },
        min: 30,   //最小值
        max:180,   //最大值
        gridColor: '#D8D8D8',
      },
      width: windowWidth,  //图表展示内容宽度
      height: windowHeight,  //图表展示内容高度
      dataLabel: false,  //是否在图表上直接显示数据
      dataPointShape: true, //是否在图标上显示数据点标志
      extra: {
        lineStyle: 'curve'  //曲线
      },
    });
  },
  /**
   * 生命周期函数--监听页面初次渲染完成
   */
  onReady: function () {

  },

  /**
   * 生命周期函数--监听页面显示
   */
  onShow: function () {

  },

  /**
   * 生命周期函数--监听页面隐藏
   */
  onHide: function () {

  },

  /**
   * 生命周期函数--监听页面卸载
   */
  onUnload: function () {

  },

  /**
   * 页面相关事件处理函数--监听用户下拉动作
   */
  onPullDownRefresh: function () {

  },

  /**
   * 页面上拉触底事件的处理函数
   */
  onReachBottom: function () {

  },

  /**
   * 用户点击右上角分享
   */
  onShareAppMessage: function () {

  },
})
调制
实际项目当中可能我们的线条的颜色和数据点的形状可能跟默认的不一样怎么办呢?
没关系,我们打开wxCharts.js
var config = {
yAxisWidth: 15,
yAxisSplit: 5, //这个是把y轴平分成几分的
xAxisHeight: 15,
xAxisLineHeight: 15,
legendHeight: 15,
yAxisTitleWidth: 15,
padding: 12,
columePadding: 3,
fontSize: 10,
// dataPointShape: [‘diamond’, ‘circle’, ‘triangle’, ‘rect’], // 这里是改变数据点的形状的
dataPointShape: [‘circle’],
// colors: [‘#7cb5ec’, ‘#f7a35c’, ‘#434348’, ‘#90ed7d’, ‘#f15c80’, ‘#8085e9’], //这里是数据线条以及相应的数据点的颜色
colors: [‘#6EB9FF’, ‘#ECB97D’,’#51DBA2’],
pieChartLinePadding: 25,
pieChartTextPadding: 15,
xAxisTextPadding: 3,
titleColor: ‘#333333’,
titleFontSize: 20,
subtitleColor: ‘#999999’,
subtitleFontSize: 15,
toolTipPadding: 3,
toolTipBackground: ‘#000000’,
toolTipOpacity: 0.7,
toolTipLineHeight: 14,
radarGridCount: 3,
radarLabelTextMargin: 15
};
以上是我使用wxCharts的项目经验,感谢wxChatrs开发人员,请大家多多指教


