C# 雷达图的算法
本人原创,无私奉献,雕虫小技让大家见笑。
下面是C# 源码,看不明白的可以留言。
工具:VS2017
using System;
using System.Collections.Generic;
using Luman.Practices.NHBaseCore.Enum;
using Luman.Project.ClientShare.Sys.Base;
using Luman.Project.ServerBaseData.Base;
using Luman.Tdrc.ServerData.MidEntities.Arh;
using Luman.Tdrc.ShareModule.DataVisual.Base;
using Luman.Tdrc.ShareModule.Events;
using OxyPlot;
using OxyPlot.Annotations;
using OxyPlot.Axes;
using OxyPlot.Series;
using Prism.Regions;
namespace Luman.Tdrc.RepairModule.BigScreen
{
///
/// 设备基本信息
///
public class RadarViewModel : BaseVisualDataGridViewModel
{
public RadarViewModel()
{
EventAgg.GetEvent
}
protected override void RefreshData(NavigationContext navigationContext)
{
base.RefreshData(navigationContext);
//#if DEBUG
// CurItem = DataGridHelp
// if (CurItem != null)
// Radar();
//#endif
}
private void GetBigScreenRepairSelectedEvent(BigScreenRepairSelectedEventArg arg)
{
var repairData = arg.SelectedRepairData;
var equipmentId = repairData.EquipmentTotalId;
CurItem = DataGridHelp
if (CurItem != null)
Radar();
}
#region 属性
public PlotModel PlotModel
{
get => _plotModel;
set => SetProperty(ref _plotModel, value);
}
private PlotModel _plotModel;
public List
#endregion
#region 命令
private void Radar()
{
ArgList = new List
{
new EquipmentArg() {Name = "设备功率", Value = double.Parse(CurItem.TotalPower)},
new EquipmentArg() {Name = "额定电流", Value = double.Parse(CurItem.RateCurrent)},
new EquipmentArg() {Name = "设备行程", Value = double.Parse(CurItem.Stroke)},
new EquipmentArg() {Name = "最大开口", Value = double.Parse(CurItem.MaxDaylight)},
new EquipmentArg() {Name = "工作速度", Value = double.Parse(CurItem.SlideWorkSpeed)},
new EquipmentArg() {Name = "快下速度", Value = double.Parse(CurItem.SlideFastDownSpeed)}
};
CreateRadar();
PlotModel.InvalidatePlot(true);
}
public void CreateRadar()
{
PlotModel = new PlotModel
{
PlotAreaBorderThickness = new OxyThickness(0),
PlotMargins = new OxyThickness(10, 10, 10, 10),
Background = OxyColor.FromArgb(0, 48, 48, 48),
PlotAreaBackground = OxyColor.FromArgb(0, 48, 48, 48),
PlotAreaBorderColor = OxyColor.FromArgb(0, 48, 48, 48),
};
PlotModel.Axes.Add(new LinearAxis
{
Maximum = 120,
Minimum = -120,
PositionAtZeroCrossing = true,
AxislineStyle = LineStyle.Solid,
TickStyle = TickStyle.Crossing,
AxislineColor = OxyColor.FromArgb(0, 252, 252, 252),
TicklineColor = OxyColor.FromArgb(0, 252, 252, 252),
MinorTicklineColor = OxyColor.FromArgb(0, 252, 252, 252),
TextColor = OxyColor.FromArgb(0, 252, 252, 252),
});
PlotModel.Axes.Add(new LinearAxis
{
Maximum = 140,
Minimum = -140,
Position = AxisPosition.Bottom,
PositionAtZeroCrossing = true,
AxislineStyle = LineStyle.Solid,
TickStyle = TickStyle.Crossing,
AxislineColor = OxyColor.FromArgb(0, 252, 252, 252),
TicklineColor = OxyColor.FromArgb(0, 252, 252, 252),
MinorTicklineColor = OxyColor.FromArgb(0, 252, 252, 252),
TextColor = OxyColor.FromArgb(0, 252, 252, 252),
});
for (int i = 0; i < 6; i++)
{
PlotModel = MakeTriangle1(PlotModel, (double)i);
}
var tan120 = Math.Tan(120.0 / 180 * Math.PI);
PlotModel = MakeTriangle12(PlotModel, 100, tan120);
PlotModel = MakeTriangle12(PlotModel, -100, -tan120);
PlotModel = MakeTriangle12(PlotModel, -100, tan120);
PlotModel = MakeTriangle12(PlotModel, 100, -tan120);
PlotModel = MakeTriangle13(PlotModel, 100);
PlotModel = MakeTriangle13(PlotModel, -100);
var areaSeries1 = new AreaSeries
{
Fill = OxyColor.FromArgb(180, 0, 191, 255),
};
for (int i = 0; i < 7; i++)
{
if (i >= 6)
areaSeries1 = MakeArea(areaSeries1, 0, ArgList[0], false);
else
{
areaSeries1 = MakeArea(areaSeries1, i, ArgList[i], true);
MakeArgLabel(100, i, ArgList[i].Name);
}
}
PlotModel.Series.Add(areaSeries1);
}
//画外围文字
public void MakeArgLabel(double lineLength, int triangleCount, string argName)
{
var cos60 = Math.Cos((60.0 * triangleCount / 180) * Math.PI);
var sin60 = Math.Sin((60.0 * triangleCount / 180) * Math.PI);
var x = lineLength * cos60;
var y = lineLength * sin60;
x = x < 0.0 ? x - 15 : x + 15;
if (y < 0.0)
y = y - 20;
else
y = y + 5;
var text = new TextAnnotation
{
TextPosition = new DataPoint(x, y),
Text = argName,
FontSize = 14,
TextColor = OxyColor.FromRgb(192, 192, 192),
Stroke = OxyColor.FromArgb(0, 0, 191, 255),
StrokeThickness = 0,
};
PlotModel.Annotations.Add(text);
}
//画区域图形
public AreaSeries MakeArea(AreaSeries area, int triangleCount, EquipmentArg arg, bool makeLable)
{
var cos60 = Math.Cos((60.0 * triangleCount / 180) * Math.PI);
var sin60 = Math.Sin((60.0 * triangleCount / 180) * Math.PI);
var x = arg.Value * cos60;
var y = arg.Value * sin60;
area.Points.Add(new DataPoint(x, y));
if (makeLable)
{
var point = new PointAnnotation
{
X = x,
Y = y,
Text = arg.Value.ToString(),
FontSize = 10,
TextColor = OxyColor.FromRgb(0, 191, 255),
Shape = MarkerType.Circle,
Size = 3,
Fill = OxyColor.FromArgb(0, 0, 191, 255),
Stroke = OxyColor.FromRgb(0, 191, 255),
StrokeThickness = 2,
};
PlotModel.Annotations.Add(point);
}
return area;
}
//画上下2个三角形
public PlotModel MakeTriangle13(PlotModel plotModel, double lineMaxin)
{
var cos60 = Math.Cos(60.0 / 180 * Math.PI);
var sin60 = Math.Sin(60.0 / 180 * Math.PI);
var lineCount = 4;
for (int i = 0; i < lineCount; i++)
{
var y = (lineMaxin - (lineMaxin / lineCount) * i) * sin60;
var x = (lineMaxin - (lineMaxin / lineCount) * i) * cos60;
var line3 = new LineAnnotation
{
LineStyle = LineStyle.Solid,
Color = OxyColor.FromArgb(100, 0, 191, 255),
StrokeThickness = 2,
MinimumX = -x,
MaximumX = x,
Y = y,
Type = LineAnnotationType.Horizontal,
};
plotModel.Annotations.Add(line3);
}
return plotModel;
}
//画4个三角形
public PlotModel MakeTriangle12(PlotModel plotModel, double xmaxin, double slope)
{
var lineCount = 4;
for (int i = 0; i < lineCount; i++)
{
var maxim = xmaxin - (xmaxin / lineCount) * i;
var minim = maxim / 2;
var intercept = -slope * maxim;
if (maxim < minim)
{
var temp = maxim;
maxim = minim;
minim = temp;
}
var line2 = new LineAnnotation //外边
{
LineStyle = LineStyle.Solid,
Color = OxyColor.FromArgb(100, 0, 191, 255),
StrokeThickness = 2,
MinimumX = minim,
MaximumX = maxim,
Intercept = intercept,
Slope = slope,
Type = LineAnnotationType.LinearEquation,
};
plotModel.Annotations.Add(line2);
}
return plotModel;
}
//画6条内边
public PlotModel MakeTriangle1(PlotModel plotModel, double count)
{
var tan60 = Math.Tan((60 + 60 * count) / 180 * Math.PI);
var cos60 = Math.Cos((60 + 60 * count) / 180 * Math.PI);
var x1 = 100 * cos60;
var max = x1;
var mini = 0.0;
if (x1 < 0)
{
var temp = x1;
max = 0;
mini = temp;
}
var line1 = new LineAnnotation //内边
{
LineStyle = LineStyle.Solid,
Color = OxyColor.FromArgb(100, 0, 191, 255),
StrokeThickness = 2,
MinimumX = mini,
MaximumX = max,
Intercept = 0,
Slope = tan60,
Type = LineAnnotationType.LinearEquation,
};
plotModel.Annotations.Add(line1);
return plotModel;
}
#endregion
public class EquipmentArg : MidEntity
{
///
/// 参数名称
///
public virtual string Name
{
get { return _name; }
set { _name = value; OnPropertyChanged(); }
}
private string _name;
///
/// 设备参数值
///
public virtual double Value
{
get { return _value; }
set { _value = value; OnPropertyChanged(); }
}
private double _value;
}
}
}
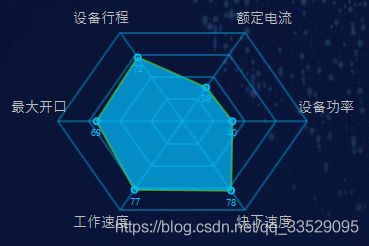
运行效果如下。