机器学习教程篇1 -- 线性回归(上)最小二乘法
机器学习 -- 线性回归
- 一、最小二乘法
- 1、概念
- 2、内容讲解
- (1)模型结构
- (2)误差函数
- (3)代码
- (4)调用Scikit-learn库进行开发
“好好学习,天天向上” –
机器学习的第一个教程开始啦,后续会附上视频讲解
一、最小二乘法
1、概念
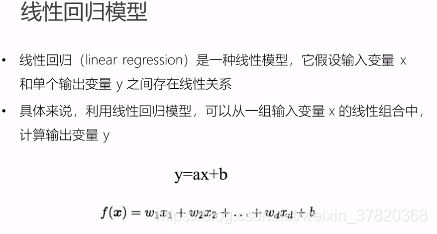
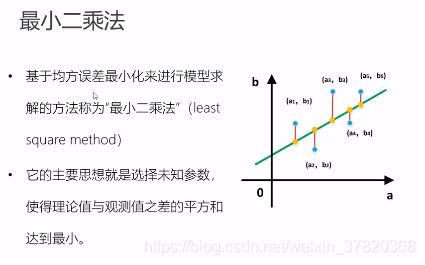
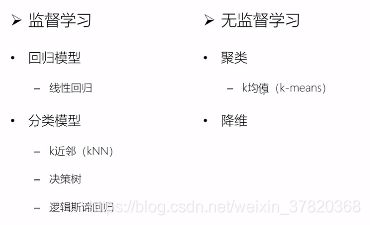
线性回归是很常见的一种回归,线性回归可以用来预测或者分类,主要解决线性问题。主要解决的就是如何通过样本来获取最佳的拟合线。现在使用得比较广泛的就是梯度下降和最小二乘法,,它是一种数学优化技术,它通过最小化误差的平方和寻找数据的最佳函数匹配。在有监督学习问题中,线性回归是一种最简单的建模手段。这里首先讲解最小二乘法。
2、内容讲解
(1)模型结构
从线性回归模型开始讲起,由式子,最后是一条高维空间的直线(因为这里的x都是一次项的),最终的目的是求出a和b,也就是所有的x和b,为了让所有的点都在线上,就要不断调整w(系数,也即权重)。随着维度的增加,计算量也增加,用一组向量就可以表示所有的系数。注意这里W是列向量。
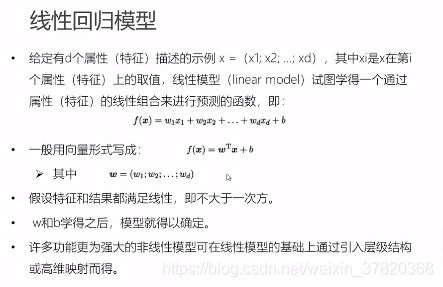
所以确定W和b就能求出y了。
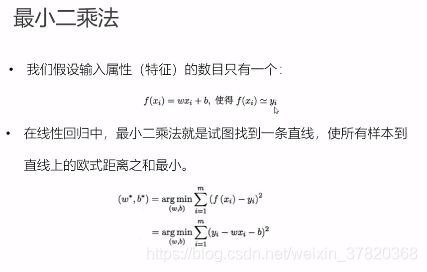
(2)误差函数
(3)代码
1、导入数据,定义损失函数和拟合函数等。
import numpy as np
import matplotlib.pyplot as plt
points = np.genfromtxt('data.csv', delimiter=',')

#定义损失函数,w,b计算好传入,再传输标准值,从而求导误差
#模块:损失函数
def compete_cost(w, b, points):
    total_cost = 0
    #求误差
    for i in range(len(points)):
        x = points[i, 0]
        y = points[i, 1]
        total_cost += (y - w*x - b ) ** 2

    return total_cost/len(points)

###接下来定义拟合算法,求w和b
#根据线性回归的求取方法,我们需要定义一个平均值的函数
def average(data):
    sum = 0
    for i in range(len(data)):
        sum += data[i]
    return sum/len(data)
#根据公式,定义最重要的拟合函数,这里求取的就是w和b这两组系数
#将w,b代入误差函数之后,就可以得到线性误差
#深度学习的话,就是可以不断调整w和b,直到求取到最合适的权重和偏差,
#也就是所谓的训练过程

#拟合函数
def fit(points):
    M = len(points)
    x_bar = average(points[:, 0])

    sum_yx = 0
    sum_x2 = 0
    b = 0

    for i in range(M):
        x = points[i, 0]
        y = points[i ,1]
        sum_yx += y * (x - x_bar)
        sum_x2 += x ** 2

    #根据公式
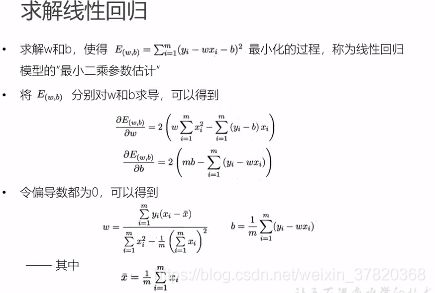
    w = sum_yx / (sum_x2 - M * (x_bar ** 2))

    for i in range(M):
        x = points[i, 0]
        y = points[i ,1]
        b += (1/M)*(y - w*x)
    b = b
    return w, b

#测试
w, b = fit(points)
print("w is:", w)
print("b is:", b)
cost = compete_cost(w, b, points)
print("cost is:", cost)

#画线
import matplotlib.pyplot as plt

x = points[:, 0]
y = points[:, 1]
plt.scatter(x, y)
pred_y = w*x + b

plt.plot(x, pred_y, c='b')
plt.show()
2、最小二乘法
###模块0 引入包
import numpy as np
import matplotlib.pyplot as plt #画线

###模块1 加入数据
points = np.genfromtxt('./ShangGuiGu/data.csv', delimiter=',')
points[0,0]

# 提取points中的两列数据,分别作为x,y
x = points[:, 0]
y = points[:, 1]

# 用plt画出散点图
plt.scatter(x, y)
plt.show()

###模块2 定义损失函数  1和0属于预处理方面,都是一些常规性的导入
#定义损失函数,w,b计算好传入,再传输标准值,从而求导误差
#模块:损失函数
def compete_cost(w, b, points):
    total_cost = 0

    #求误差
    for i in range(len(points)):
        x = points[i, 0]
        y = points[i, 1]
        total_cost += (y - w*x - b ) ** 2

    return total_cost/len(points)

###模块3 超参数的选取,初始化定义
alpha = 0.0002
init_w = 0
init_b = 0
num_iter = 10

###模块4 定义梯度下降算法函数
#训练函数  需要:原始数据、权重、偏置、学习率、训练次数  还有最重要的梯度更新函数
def grad_desc(points, init_w, init_b, alpha, num_iter):
    w = init_w
    b = init_b

    #定义一个list保存所有的损失函数值,用来显示下降的过程
    cost_list = []

    #训练过程
    for i in range(num_iter):
        cost_list.append( compete_cost(w, b, points))
        w, b = step_grad_desc(w, b, alpha, points)

    return [w, b, cost_list]

#传说中的梯度更新函数,也就是夹杂求导函数(我们所说的算法就放在这里)的更新函数
def step_grad_desc(current_w, current_b, alpha, points):
    #根据公式,我们就可以对应公式,将每一项表示并求出来(变量也是根据这个来定义)
    #以后的设计也是这样,1弄好算法2根据化简后的算法,定义出相应的函数
    #代码秘诀:一个求和符号 = 一个for循环,+= 用一个sum_来接收就好 而且此处还是一个大局部的变量
    #公式秘诀:看公式的最简式,看看可不可以化简,另一种方式就是一层一层往上代
    #最原始的式子,把式子弄成已知的情况
    sum_grad_w = 0
    sum_grad_b = 0
    M = len(points)

    #根据公式写
    for i in range(M):
        x = points[i, 0]
        y = points[i, 1]
        sum_grad_w += (current_w * x + current_b - y) * x
        sum_grad_b += current_w * x + current_b - y

    #用公式求当前梯度
    grad_w = 2/M * sum_grad_w

    grad_b = 2/M * sum_grad_b

    #梯度下降
    updated_w = current_w - alpha * grad_w
    updated_b = current_b - alpha * grad_b

    return updated_w, updated_b

###模块5 测试
w, b, cost_list = grad_desc(points, init_w, init_b, alpha, num_iter)

print("w is:%s" % w)
print("b is:%s" % b)

cost = compete_cost(w, b, points)
print("cost is:%s" % cost)


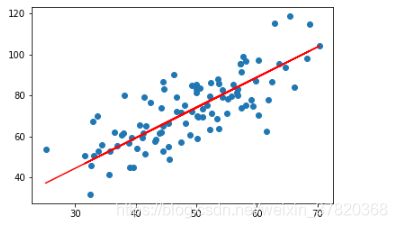
plt.plot(cost_list)
plt.show()
x = points[:, 0]
y = points[:, 1]

plt.scatter(x, y)
pred_y = w*x + b

plt.plot(x, pred_y, c='r')
plt.show()
(4)调用Scikit-learn库进行开发
到第三步已经把原理剖析得很清楚了,在这个基础上,我们用sk-learn来进行开发。然而实际上,机器学习的开发基本都是用这个库来进行开发的,是机器学习中常用的第三方模块,里面包含了很多便利的包,包括回归(Regression)、降维(Dimensionality Reduction)、分类(Classfication)、聚类(Clustering)等方法。
还是刚刚的场景,导入sklearn的包,代码入下
import numpy as np
import matplotlib.pyplot as plt

points = np.genfromtxt('./ShangGuiGu/data.csv', delimiter=',')

points[0,0]

# 提取points中的两列数据,分别作为x,y
x = points[:, 0]
y = points[:, 1]

# 用plt画出散点图
plt.scatter(x, y, c='b')
plt.show()

# 损失函数是系数的函数,另外还要传入数据的x,y
def compute_cost(w, b, points):
    total_cost = 0
    M = len(points)

    # 逐点计算平方损失误差,然后求平均数
    for i in range(M):
        x = points[i, 0]
        y = points[i, 1]
        total_cost += ( y - w * x - b ) ** 2

    return total_cost/M

#前三步都是一样的,之后就算是框架不同,也只是顺序不一样而已
from sklearn.linear_model import LinearRegression
lr = LinearRegression()

x_new = x.reshape(-1, 1)
y_new = y.reshape(-1, 1)

lr.fit(x_new, y_new)

## 从训练好的模型中提取系数和截距
w = lr.coef_[0][0]
b = lr.intercept_[0]

print("w is: ", w)
print("b is: ", b)

cost = compute_cost(w, b, points)

print("cost is: ", cost)

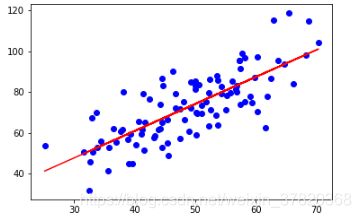
plt.scatter(x, y, c='b')
# 针对每一个x,计算出预测的y值
pred_y = w * x + b

plt.plot(x, pred_y, c='r')
plt.show()
