用kmeans对图片像素进行聚类
用kmeans对图片像素进行聚类
对sklearn中kmeans的简单应用
1,获得示例图像
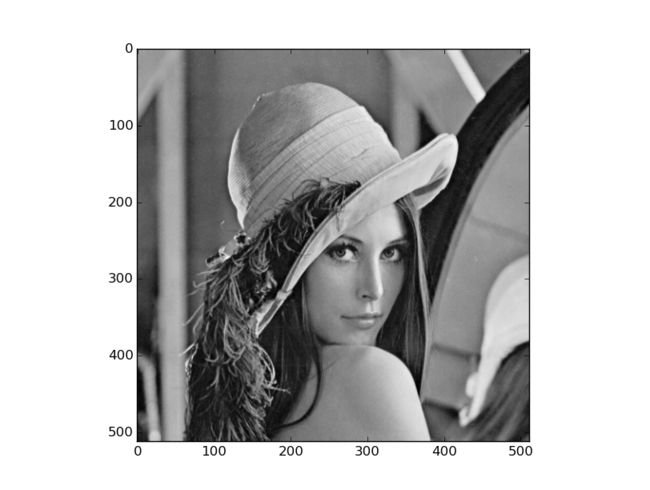
在scipy.misc 模块中有一个函数可以载入lena图像
from scipy import misc
lena = misc.lena()

plt.subplot()
plt.imshow(lena,cmap=plt.cm.gray)
使用灰度颜色表把图显示出来

因为把图像转为矩阵的话,矩阵中的值就是灰度值,lena的矩阵如下所示:
In [7]: lena
Out[7]:
array([[162, 162, 162, ..., 170, 155, 128],
       [162, 162, 162, ..., 170, 155, 128],
       [162, 162, 162, ..., 170, 155, 128],
       ...,
       [ 43,  43,  50, ..., 104, 100,  98],
       [ 44,  44,  55, ..., 104, 105, 108],
       [ 44,  44,  55, ..., 104, 105, 108]])
这次是对图像中的灰度值进行聚类,要把lena转换成下列的格式(红色部分),不能用绿色部分进行聚类,原因可能是该算法把列表中的元素当成向量来计算,所以不能是具体的数,只是我自己猜的。
In [9]: image = lena.ravel()

In [10]: image
Out[10]: array([162, 162, 162, ..., 104, 105, 108])

In [11]: image.resize(len(image),1)

In [12]: image
Out[12]:
array([[162],
       [162],
       [162],
       ...,
       [104],
       [105],
       [108]])
2,使用kmeans进行聚类
from sklearn.cluster import Kmeans
kmeans = Kmeans(n_clusters=2)
kmeans.fit(image)#进行聚类
pre = kmeans.predict(image)
pre.resize(512,512)
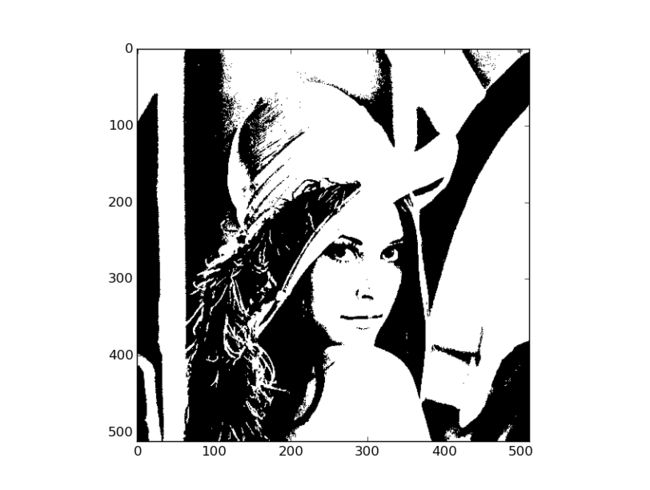
plt.imshow(pre,cmap=plt.cm.gray)
下图即为聚类后的图像,只用黑白两种颜色显示lena

上面代码中的kmeans还有三个属性
cluster_centers_: array, [n_clusters, n_features]
Coordinates of cluster centers
labels_ ::
Labels of each point
inertia_: float
Sum of distances of samples to their closest cluster center.
因为这次是对一维向量进行的聚类,所以kmeans.labels_和kmeans.predict(image)的结果是一样的,
但是我还不知道为什么0和1组成的矩阵和0和255组成的矩阵显示的效果是一样的
参考资料:
使用sklearn做kmeans聚类分析
http://blog.itpub.net/12199764/viewspace-1479320/
sklearn.cluster.KMeans
http://scikit-learn.org/stable/modules/generated/sklearn.cluster.KMeans.html