02 Python Matplotlib 库的样式设置(颜色、线条、标记样式)
02 设置图表样式
#linewidth 绘制线条宽度
plt.plot(a,s, linewidth = 6)
#添加x,y轴名称
plt.xlabel('x')
plt.ylabel('y = x^2')

#给图标添加图名
plt.rcParams['font.sans-serif'] = ['SimHei']  # 中文下的字体格式进行修改对
plt.title('多点绘制')
plt.show()
绘制不同样式不同颜色的线
并使用 legend()方法 ,给 plot添加 label参数
x = np.linspace(0, 10, 100)
plt.plot(x, x+0, '--g', label = "--g")
plt.plot(x, x+1, '-.r', label = '-.r')
plt.plot(x, x+2, ':b', label = ':b')
plt.plot(x, x+3, ',c', label = ',c')
plt.plot(x, x+4, '*y', label = '*y')
plt.plot(x, x+5, '.k', label = '.k')
plt.legend(loc = 'lower right',       # 默认在左上角即 upper left 可以通过loc进行修改
           fancybox = True,           # 边框
           framealpha = 0.5,          # 透明度
           shadow = True,             # 阴影
           borderpad = 1)             # 边框宽度
plt.show()
格式化字符
| 格式 | 样式 |
|---|---|
| ‘-’ | 实线样式 |
| ‘–’ | 短横线样式 |
| ‘-.’ | 点划线样式 |
| ‘:’ | 虚线样式 |
| ‘.’ | 点标记 |
| ‘,’ | 像素标记 |
| ‘o’ | 圆标记 |
| ‘v’ | 倒三角标记 |
| ‘^’ | 正三角标记 |
| ‘<’ | 左三角标记 |
| ‘>’ | 右三角标记 |
| ‘1’ | 下箭头标记 |
| ‘2’ | 上箭头标记 |
| ‘3’ | 左箭头标记 |
| ‘4’ | 右箭头标记 |
| ‘s’ | 正方形标记 |
| ‘p’ | 五边形标记 |
| ‘*’ | 星形标记 |
| ‘h’ | 六边形标记 1 |
| ‘H’ | 六边形标记 2 |
| ‘+’ | 加号标记 |
| ‘x’ | X 标记 |
| ‘D’ | 菱形标记 |
| ‘d’ | 窄菱形标记 |
| ‘|’ | 竖直线标记 |
| ‘_’ | 水平线标记 |
常用色彩
| 代码 | 色彩 |
|---|---|
| ‘b’ | 蓝色 |
| ‘g’ | 绿色 |
| ‘r’ | 红色 |
| ‘c’ | 青色 |
| ‘m’ | 品红色 |
| ‘y’ | 黄色 |
| ‘k’ | 黑色 |
| ‘w’ | 白色 |
Matplotlib 色彩展示
基础颜色
`python
import matplotlib.pyplot as plt
import matplotlib.patches as patches
import matplotlib.colors as colors
import math


fig = plt.figure()
ax = fig.add_subplot(111)

ratio = 1.0 / 3.0
count = math.ceil(math.sqrt(len(colors.cnames)))
x_count = count * ratio
y_count = count / ratio
x = 0
y = 0
w = 1 / x_count
h = 1 / y_count

for c in colors.cnames:
    pos = (x / x_count, y / y_count)
    ax.add_patch(patches.Rectangle(pos, w, h, color=c))
    ax.annotate(c, xy=pos)
    if y >= y_count-1:
        x += 1
        y = 0
    else:
        y += 1

plt.show()

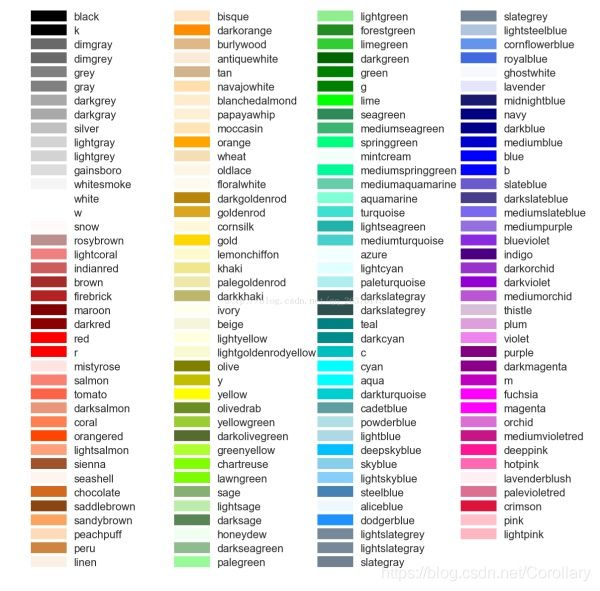
具体参考 Matplotlib官网参考资料
渐变颜色
import numpy as np
import matplotlib.pyplot as plt
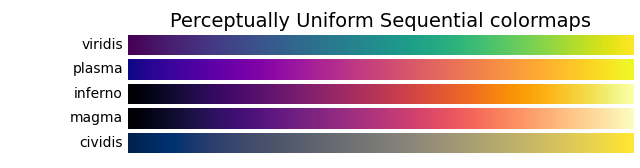
cmaps = [('Perceptually Uniform Sequential', [
'viridis', 'plasma', 'inferno', 'magma', 'cividis']),
('Sequential', [
'Greys', 'Purples', 'Blues', 'Greens', 'Oranges', 'Reds',
'YlOrBr', 'YlOrRd', 'OrRd', 'PuRd', 'RdPu', 'BuPu',
'GnBu', 'PuBu', 'YlGnBu', 'PuBuGn', 'BuGn', 'YlGn']),
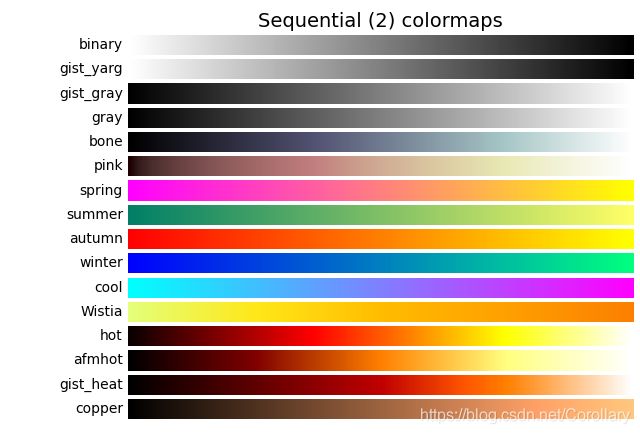
('Sequential (2)', [
'binary', 'gist_yarg', 'gist_gray', 'gray', 'bone', 'pink',
'spring', 'summer', 'autumn', 'winter', 'cool', 'Wistia',
'hot', 'afmhot', 'gist_heat', 'copper']),
('Diverging', [
'PiYG', 'PRGn', 'BrBG', 'PuOr', 'RdGy', 'RdBu',
'RdYlBu', 'RdYlGn', 'Spectral', 'coolwarm', 'bwr', 'seismic']),
('Cyclic', ['twilight', 'twilight_shifted', 'hsv']),
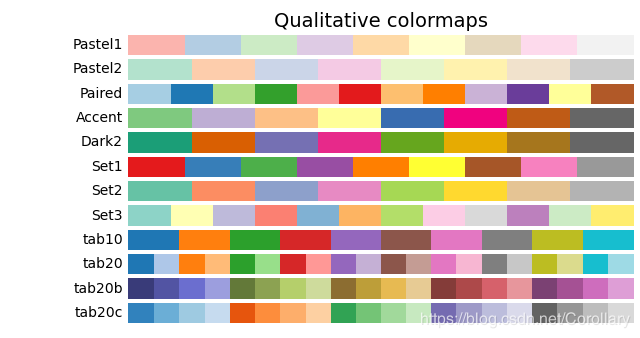
('Qualitative', [
'Pastel1', 'Pastel2', 'Paired', 'Accent',
'Dark2', 'Set1', 'Set2', 'Set3',
'tab10', 'tab20', 'tab20b', 'tab20c']),
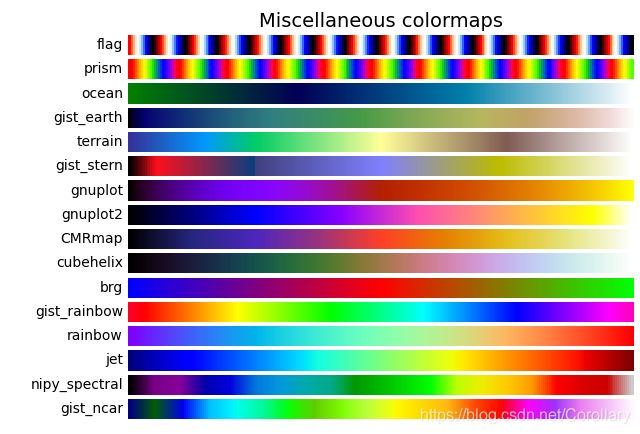
('Miscellaneous', [
'flag', 'prism', 'ocean', 'gist_earth', 'terrain', 'gist_stern',
'gnuplot', 'gnuplot2', 'CMRmap', 'cubehelix', 'brg',
'gist_rainbow', 'rainbow', 'jet', 'nipy_spectral', 'gist_ncar'])]
gradient = np.linspace(0, 1, 256)
gradient = np.vstack((gradient, gradient))
def plot_color_gradients(cmap_category, cmap_list):
# Create figure and adjust figure height to number of colormaps
nrows = len(cmap_list)
figh = 0.35 + 0.15 + (nrows + (nrows-1)*0.1)*0.22
fig, axs = plt.subplots(nrows=nrows, figsize=(6.4, figh))
fig.subplots_adjust(top=1-.35/figh, bottom=.15/figh, left=0.2, right=0.99)
axs[0].set_title(cmap_category + ' colormaps', fontsize=14)
for ax, name in zip(axs, cmap_list):
ax.imshow(gradient, aspect='auto', cmap=plt.get_cmap(name))
ax.text(-.01, .5, name, va='center', ha='right', fontsize=10,
transform=ax.transAxes)
# Turn off *all* ticks & spines, not just the ones with colormaps.
for ax in axs:
ax.set_axis_off()
for cmap_category, cmap_list in cmaps:
plot_color_gradients(cmap_category, cmap_list)
plt.show()
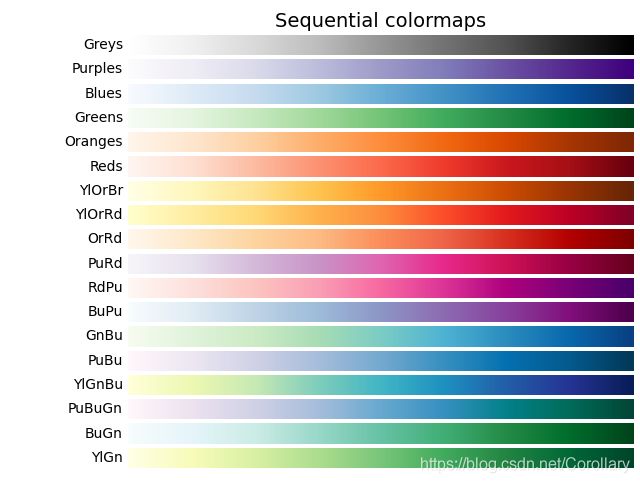


具体参考 Matplotlib官网参考资料