逻辑回归
1逻辑回归知识点小结
分类问题的一些例子
- 判断一封电子邮件是否是垃圾邮件
- 判断一次金融交易是否是欺诈
- 判断一个肿瘤是良性还是恶性
假说表示
- 逻辑回归模型的假设是:
h θ ( x ) = g ( θ T X ) h_{\theta}(x)=g\left(\theta^{T} X\right) hθ(x)=g(θTX)
X 特征向量
g 逻辑函数sigmoid function
sigmoid function的代码实现:
g ( z ) = 1 1 + e − z g(z)=\frac{1}{{1+e^{-z}}} g(z)=1+e−z1
import numpy as np
def sigmoid(z):
    return 1/(1+np.exp(-z))
对回归模型的理解
- 对于给定的输入变量,根据选择的参数计算输出变量为1(正向类)的可能性,即:
h θ ( x ) = P ( y = 1 ∣ x ; θ ) h_{\theta}(x)=P(y=1|x;{\theta}) hθ(x)=P(y=1∣x;θ)
判定边界
- 逻辑回归:
h θ ( x ) = g ( θ T X ) = P ( y = 1 ∣ x ; θ ) h_{\theta}(x)=g\left(\theta^{T} X\right)=P(y=1|x;{\theta}) hθ(x)=g(θTX)=P(y=1∣x;θ) g ( x ) = 1 / 1 + e − z g(x)=1/{1+e^{-z}} g(x)=1/1+e−z
当 h θ ( x ) h_{\theta}(x) hθ(x)大于等于0.5时,预测y=1
当 h θ ( x ) h_{\theta}(x) hθ(x)小于0.5时,预测y=0
上面例子:当-3+x1+x2大于等于0,即x1+x2大于等于3时,模型将预测y=1
代价函数
J ( θ ) = 1 m ∑ i = 1 m [ − y ( i ) log ( h θ ( x ( i ) ) ) − ( 1 − y ( i ) ) log ( 1 − h θ ( x ( i ) ) ) ] J\left( \theta \right)=\frac{1}{m}\sum\limits_{i=1}^{m}{[-{{y}^{(i)}}\log \left( {{h}_{\theta }}\left( {{x}^{(i)}} \right) \right)-\left( 1-{{y}^{(i)}} \right)\log \left( 1-{{h}_{\theta }}\left( {{x}^{(i)}} \right) \right)]} J(θ)=m1i=1∑m[−y(i)log(hθ(x(i)))−(1−y(i))log(1−hθ(x(i)))]
- 代码实现:
import numpy as np
def cost(theta,X,y):
    theta=np.matrix(theta)
    X=np.matrix(X)
    y=np.matrix(y)
    first=np.multipy(-y,np.log(sigmoid(X*theta.T)))
    second=np.multipy((1-y),np.log(1-sigmoid(X*theta.T)))
    return np.sum(first-second)/len(X)
简化的成本函数和梯度下降
- 用梯度下降法最小化逻辑回归中的代价函数 J ( θ ) J({\theta}) J(θ)
高级优化
- 共轭梯度法BFGS(变尺度法)、L-BFGS(限制变尺度法)
- 线性搜索算法(linear search)
多类别分类
- 自动归类邮件(1:工作;2:朋友;3:家人)
- 药物诊断(1:没有感冒;2:感冒;3:流感)
- 天气分类问题(1:晴天;2:阴天;3:雪天)
过拟合问题
- 丢弃一些不能帮助正确预测的特征。手工选择保留哪些特征/使用一些模型选择算法来帮忙(PCA)
- 正则化。保留所有的特征,但是减少参数的大小(magnitude)
2 预测某位学生能否被录取
- 数据可视化
import numpy as np
import pandas as pd
import matplotlib.pyplot as plt

path = 'ex2data1.txt'
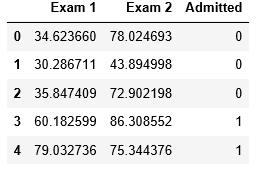
data = pd.read_csv(path, header = None, names = ['Exam 1', 'Exam 2', 'Admitted'])
data.head()#前5组数据
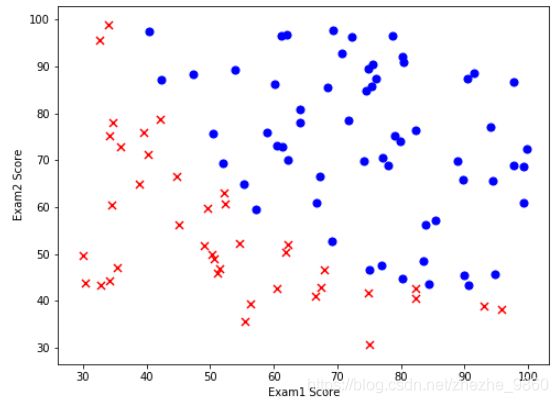
# 绘制散点图
# 紫色圆点 录取
# 红色差号 未录取
positive = data[ data['Admitted'].isin([1]) ]
negative = data[ data['Admitted'].isin([0]) ]

fig,ax = plt.subplots(figsize = (8,6))
ax.scatter(positive['Exam 1'], positive['Exam 2'], s = 50, c = 'b', marker = 'o', label = 'Admitted')
ax.scatter(negative['Exam 1'], negative['Exam 2'], s = 50, c = 'r', marker = 'x', label = 'Not Admitted')
ax.legend
ax.set_xlabel('Exam1 Score')
ax.set_ylabel('Exam2 Score')
- pandas中isin()函数
isin()接收一个列表,判断该列中元素是否在列表中
df = pd.DataFrame( np.random.randn(4,4), columns=['A','B','C','D'] )
df
df.A > 0 #布尔索引
df[ df.A > 0 ] #布尔索引应用

#使用isin()
df['E'] = ['a','a','b','c'] #添加一列E
df['E'].isin(['a', 'b', 'c']) #判断E这一列有没有元素 a b c

df.isin(['a', 'b']) #判断df中有没有 a b
df[ df['E'].isin(['a']) ] #将E列中有元素a的列生成一个新的DataFrame
- 使用逻辑回归,训练模型来预测结果.实现逻辑回归
Sigmoid函数
g g g代表一个常用的逻辑函数,形状为 “ S ” “S” “S”形,称 S S S形函数
g ( z ) = 1 1 + e − z g(z)=\frac{1}{{1+{e}^{-z}}} g(z)=1+e−z1合起来,得到逻辑回归模型的假设函数
h θ ( x ) = 1 1 + e − θ T X h_{\theta}(x)=\frac{1}{1+{e}^{-{\theta}^{T}X}} hθ(x)=1+e−θTX1
def sigmoid(z):
    return 1/(1+np.exp(-z))
- 代价函数
J ( θ ) = 1 m ∑ i = 1 m [ − y ( i ) log ( h θ ( x ( i ) ) ) − ( 1 − y ( i ) ) log ( 1 − h θ ( x ( i ) ) ) ] J\left( \theta \right)=\frac{1}{m}\sum\limits_{i=1}^{m}{[-{{y}^{(i)}}\log \left( {{h}_{\theta }}\left( {{x}^{(i)}} \right) \right)-\left( 1-{{y}^{(i)}} \right)\log \left( 1-{{h}_{\theta }}\left( {{x}^{(i)}} \right) \right)]} J(θ)=m1i=1∑m[−y(i)log(hθ(x(i)))−(1−y(i))log(1−hθ(x(i)))]
def cost(theta, X, y):
    theta = np.matrix(theta)
    X = np.matrix(X)
    y = np.matrix(y)
    first = np.multiply(-y, np.log(sigmoid(X * theta.T)))
    second = np.multiply((1 - y), np.log(1 - sigmoid(X * theta.T)))
    return np.sum(first - second) / (len(X))
- 预处理 矩阵
#矩阵增加一列
data.insert(0, 'Ones', 1)

#X训练集 y目标变量
cols = data.shape[1]
X = data.iloc[:,0:cols-1]
y = data.iloc[:,cols-1:cols]

X = np.array(X.values)
y = np.array(y.values)
theta = np.zeros(3)
- 计算初始化参数的代价函数(theta == 0)
cost(theta, X, y)
- batch gradient descent(批量梯度下降)
转换为向量化计算
∂ J ( θ ) ∂ θ j = 1 m ∑ i = 1 m ( h θ ( x ( i ) ) − y ( i ) ) x j ( i ) \frac{\partial J\left( \theta \right)}{\partial {{\theta }_{j}}}=\frac{1}{m}\sum\limits_{i=1}^{m}{({{h}_{\theta }}\left( {{x}^{(i)}} \right)-{{y}^{(i)}})x_{_{j}}^{(i)}} ∂θj∂J(θ)=m1i=1∑m(hθ(x(i))−y(i))xj(i)
计算梯度步长
def gradient(theta, X, y):
theta = np.matrix(theta)
X = np.matrix(X)
y = np.matrix(y)
parameters = int(theta.ravel().shape[1])
grad = np.zeros(parameters)
error = sigmoid(X * theta.T) - y
for i in range(parameters):
term = np.multiply(error, X[:,i])
grad[i] = np.sum(term) / len(X)
return grad
使用Scipy实现寻找最优参数(TNC)
最优化函数fmin_tnc()
- 有约束的多元函数问题,提供梯度信息,使用截断牛顿法
1 调用
- scipy.optimize.fmin_tnc(func, x0, fprime=None, args=(),…)
2 最常使用的参数
- func:优化的目标函数
- x0:初值
- fprime:提供优化函数func的梯度函数,不然优化函数必须返回函数值和梯度,或者设置
- approx_grad:如果设置为True,会给出近似梯度
- args:元组,是传递给优化参数的参考
3 返回值
- x:数组,返回的优化问题目标值
- nfeval:整数,function evaluation的数目
- 在进行优化的时候,每当目标优化函数被调用一次,就算一个function evaluation.在一次迭代过程中会有>多次function evaluation.这个参数不等同于迭代次数,而往往大于迭代次数.
import scipy.optimize as opt
result = opt.fmin_tnc(func = cost, x0 = theta, fprime = gradient, args = (X, y))
result
- 代价函数的结果
cost(result[0], X, y)
- 使用所学的参数theta来为数据集X输出预测
假设函数
h θ ( x ) = g ( θ T X ) = P ( y = 1 ∣ x ; θ ) h_{\theta}(x)=g\left(\theta^{T} X\right)=P(y=1|x;{\theta}) hθ(x)=g(θTX)=P(y=1∣x;θ) g ( x ) = 1 / 1 + e − z g(x)=1/{1+e^{-z}} g(x)=1/1+e−z
当 h θ ( x ) h_{\theta}(x) hθ(x)大于等于0.5时,预测y=1
当 h θ ( x ) h_{\theta}(x) hθ(x)小于0.5时,预测y=0
def predict(theta, X):
    probability = sigmoid(X * theta.T)
    return [1 if x >= 0.5 else 0 for x in probability]

theta_min = np.matrix(result[0])
predictions = predict(theta_min, X)
correct = [1 if ((a == 1 and b ==1 ) or ( a== 0 and b == 0))else 0 for (a, b) in zip(predictions, y) ]
accuracy = (sum(map(int, correct)) % len(correct))
print('accuracy = {0}%'.format(accuracy))
- 训练集的准确性达到89%
3 预测芯片的好坏 正则化逻辑回归
- 数据可视化
path = 'ex2data2.txt'
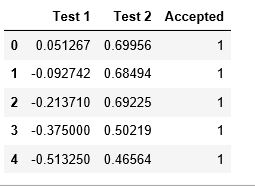
data2 = pd.read_csv(path, header = None, names = ['Test 1', 'Test 2', 'Accepted'])
data2.head()
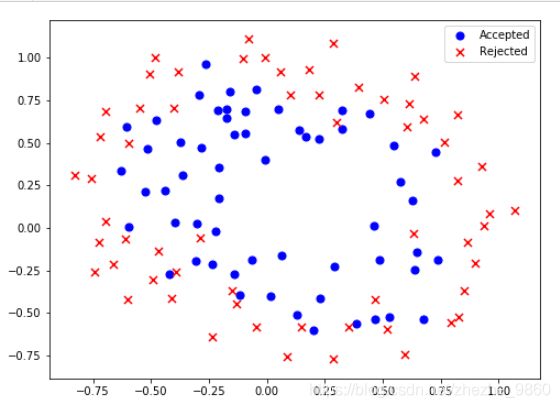
positive = data2[data2['Accepted'].isin([1])]
negative = data2[data2['Accepted'].isin([0])]

fig,ax = plt.subplots(figsize=(8,6))
ax.scatter(positive['Test 1'], positive['Test 2'], s = 50, c = 'b', marker = 'o', label = 'Accepted')
ax.scatter(negative['Test 1'], negative['Test 2'], s = 50, c = 'r', marker = 'x', label = 'Rejected')

ax.legend()
ax.set_label('Test 1 Score')
ax.set_label('Test 2 Score')
plt.show()
数据没有线性决策界限来良好的分开两类数据
使用逻辑回归构造从原始的多项式中得到的特征
- 下面创建一组多项式特征:
degree = 5
x1 = data2['Test 1']
x2 = data2['Test 2']

data2.insert(3, 'ones', 1)

for i in range(1, degree):
    for j in range(0, i):
        data2['F' + str(i) + str(j)] = np.power(x1, i - j) * np.power(x2, j)

data2.drop('Test 1', axis = 1, inplace = True)
data2.drop('Test 2', axis = 1, inplace = True)

data2.head()
- 正则化代价函数(regularized cost):
J ( θ ) = 1 m ∑ i = 1 m [ − y ( i ) log ( h θ ( x ( i ) ) ) − ( 1 − y ( i ) ) log ( 1 − h θ ( x ( i ) ) ) ] + λ 2 m ∑ j = 1 n θ j 2 J\left( \theta \right)=\frac{1}{m}\sum\limits_{i=1}^{m}{[-{{y}^{(i)}}\log \left( {{h}_{\theta }}\left( {{x}^{(i)}} \right) \right)-\left( 1-{{y}^{(i)}} \right)\log \left( 1-{{h}_{\theta }}\left( {{x}^{(i)}} \right) \right)]}+\frac{\lambda }{2m}\sum\limits_{j=1}^{n}{\theta _{j}^{2}} J(θ)=m1i=1∑m[−y(i)log(hθ(x(i)))−(1−y(i))log(1−hθ(x(i)))]+2mλj=1∑nθj2
def costReg(theta, X, y, learningRate):
    theta = np.matrix(theta)
    X = np.matrix(X)
    y = np.matrix(y)
    first = np.multiply(-y, np.log(sigmoid(X * theta.T)))
    second = np.multiply((1-y), np.log(1-sigmoid(X * theta.T)))
    reg = (learningRate / (2 * len(X))) * np.sum(np.power(theta[:,1:theta.shape[1]], 2))
    return np.sum(first - second) / len(X) + reg
- 梯度下降
θ j : = θ j ( 1 − a λ m ) − a 1 m ∑ i = 1 m ( h θ ( x ( i ) ) − y ( i ) ) x j ( i ) {{\theta }_{j}}:={{\theta }_{j}}(1-a\frac{\lambda }{m})-a\frac{1}{m}\sum\limits_{i=1}^{m}{({{h}_{\theta }}\left( {{x}^{(i)}} \right)-{{y}^{(i)}})x_{j}^{(i)}} θj:=θj(1−amλ)−am1i=1∑m(hθ(x(i))−y(i))xj(i)
def gradientReg(theta, X, y, learningRate):
    theta = np.matrix(theta)
    X = np.matrix(X)
    y = np.matrix(y)

    parameters = int(theta.ravel().shape[1])
    grad = np.zeros(parameters)

    error = sigmoid(X * theta.T) - y

    for i in range(parameters):
        term = np.multiply(error, X[:,i])

        if(i == 0):
            grad[i] = np.sum(term)/len(X)
        else:
            grad[i] = (np.sum(term)/len(X)) + ((learningRate / len(X)) * theta[:,i])
    return grad
- 初始化变量
cols = data2.shape[1]
X2 = data2.iloc[:,1:cols]
y2 = data2.iloc[:,0:1]

X2 = np.array(X2.values)
y2 = np.array(y2.values)
theta2 = np.zeros(11)
- 学习率设置为1,调用正则化函数得到0.69,然后调用梯度下降函数
- 使用fmin_TNC优化函数计算
learningRate = 1
costReg(theta2, X2, y2, learningRate)
gradientReg(theta2, X2, y2, learningRate)
result2 = opt.fmin_tnc(func = costReg, x0 = theta2, fprime = gradientReg, args = (X2, y2, learningRate))
result2
使用第一部分的预测函数查看在训练数据的准确度
theta_min = np.matrix(result2[0])
predictions = predict(theta_min, X2)
correct = [1 if ((a == 1 and b == 1) or (a == 0 and b == 0)) else 0 for (a, b) in zip(predictions, y2)]
accuracy = (sum(map(int, correct)) % len(correct))
print ('accuracy = {0}%'.format(accuracy))


