最近要准备做一个系统监控小项目,简要分析了需求之后决定用当下比较火的flume-kafka-spark-springboot-echarts来做日志统计、分析、展示。于是先学习一下flume。
flume简介
简而言之flume就是一个收集器,根据官网(https://flume.apache.org/FlumeUserGuide.html)的介绍:“Apache Flume is a distributed, reliable, and available system for efficiently collecting, aggregating and moving large amounts of log data from many different sources to a centralized data store.”可知flume是一个可扩展、可靠、可用性高、高效率的日志采集、聚集、移动的系统。
flume的结构就是agent,agent中包含了source,channel,sink三个部分分别针对数据的流入、聚合/临时存储、输出转移。

可在官网下查看关于flume的使用简介,对应做两个简单的小实验
首先下载flume对应的tar包,解压后再~./bash_profile中加上$FLUME_HOME及对应的PATH配置
使用Flume的关键就是写配置文件
- 配置Source
- 配置Channel
- 配置Sink
- 把三个组件连接起来
先在官网的指南上拿下所给的“Starting an agent”:
$ bin/flume-ng agent -n $agent_name -c conf -f conf/flume-conf.properties.template
再拿下所给的“A simple example”:
# example.conf: A single-node Flume configuration

# Name the components on this agent
a1.sources = r1
a1.sinks = k1
a1.channels = c1

# Describe/configure the source
a1.sources.r1.type = netcat
a1.sources.r1.bind = localhost
a1.sources.r1.port = 44444

# Describe the sink
a1.sinks.k1.type = logger

# Use a channel which buffers events in memory
a1.channels.c1.type = memory
a1.channels.c1.capacity = 1000
a1.channels.c1.transactionCapacity = 100

# Bind the source and sink to the channel
a1.sources.r1.channels = c1
a1.sinks.k1.channel = c1
在此解释一下:
a1: agent名称
r1: source的名称
k1: sink的名称
c1: channel的名称
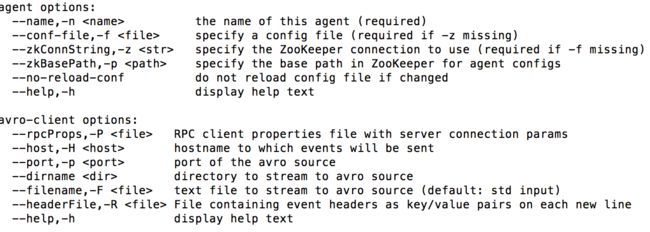
而flume-ng命令的参数可以直接在终端输入flume-ng就有解释了:
先做第一个小实验:监控TCP端口数据
在官网指南的导航栏中找到“flume source”下面的“NetCat TCP Source”根据下面的说明和之前的simple example把配置修改为:
a1.sources = r1
a1.sinks = k1
a1.channels = c1

a1.sources.r1.type = netcat
a1.sources.r1.bind = localhost
a1.sources.r1.port = 44444

a1.sinks.k1.type = logger

a1.channels.c1.type = memory
a1.channels.c1.capacity = 1000
a1.channels.c1.transactionCapacity = 100

a1.sources.r1.channels = c1
a1.sinks.k1.channel = c1
在$FLUME_HOME/conf 下创建文件example.conf
修改之前的flume-ng命令:
flume-ng agent -n a1 -c $FLUME_HOME/conf -f $FLUME_HOME/conf/example.conf -Dflume.root.logger=info,console
PS:-Dflume.root.logger=info,console是将信息打印到终端,为了方便查看
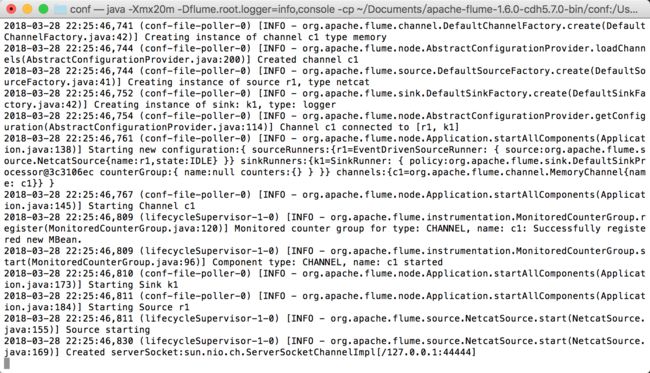
此时终端输入刚才命令后:
这时候已经在监控了!我们可以再打开一个终端,使用telnet在端口44444输入一些数据检验一下:

这时候再看看之前的终端

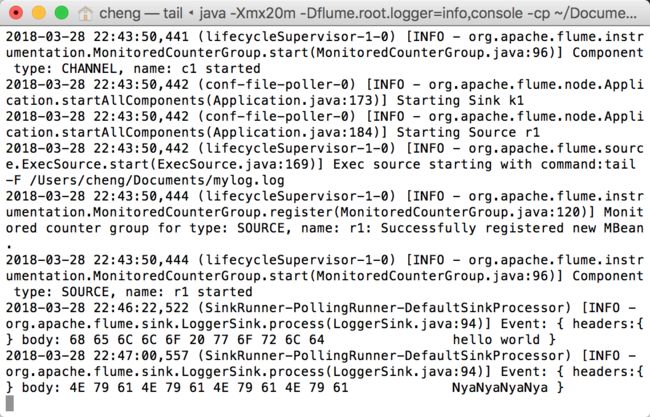
每一条数据在flume中都变成了一个event,包括了headers和body。
第二个小实验:监控文件
由于我需要的业务场景是监控日志文件,第一个实验不能满足我的需求,于是做第二个实验。
先随便找个目录创建了一个mylog.log,用于监控
这次是找到指南里的“Exec Source”,对应修改配置文件example.conf:
a1.sources = r1
a1.sinks = k1
a1.channels = c1

a1.sources.r1.type = exec
a1.sources.r1.command = tail -F /Users/cheng/Documents/mylog.log

a1.sinks.k1.type = logger

a1.channels.c1.type = memory
a1.channels.c1.capacity = 1000
a1.channels.c1.transactionCapacity = 100

a1.sources.r1.channels = c1
a1.sinks.k1.channel = c1
PS:这里使用了命令监控:tail -F /Users/cheng/Documents/mylog.log在实时观察我的文件是否被改动
再执行刚才的flume-ng命令,这时候我们在mylog.log中写一点数据试试:

这时候观察监控的终端:
以上算是flume的一些入门吧~
吐槽一下为毛给的simple example的端口是44444,不吉利!