数据可视化:在 React 项目中使用 Vega 图表 (一)
相关包
打开搜索引擎,一搜 Vega,发现相关的包有好几个,Vega, Vega-Lite, Vega-Embed,React-Vega 等等,不免让人头晕。
别急,它们之间的关系三四句话就能说明白,以下是极简介绍:
- Vega:一套数据可视化的语法。它强大、灵活。用 JSON 描述配置,以 Canvas 或者 SVG 出图。
- Vega-Lite:一套描述 Vega 配置的语法。它简易、快速。同样使用 JSON,其结果可以编译为 Vega 版本的配置。
- Vega-Embed:一个可以让你在 web 项目中使用 Vega、 Vega-Lite 的工具。
- React-Vega: 顾名思义,可以让你在 React 项目中使用 Vega、 Vega-Lite 的工具。
Vega-Lite 是描述 Vega 语法的高阶语法(有点类似 React 高阶组件的概念),它短平快的风格可以让你迅速上手,但与 Vega 相比有一些功能上的限制。
在实际使用中,可以先通过 Vega-Lite 快速把想法实现为图表,再在其编译的 Vega 版配置结果上进一步修改,增加复杂功能。
项目案例
现在网上已经有一些用 Vega 实现柱状图(bar chart)的文章,本文将主要介绍如何在 React 项目中用 Vega-Lite 语法实现一个 area chart。
图表
基本图表
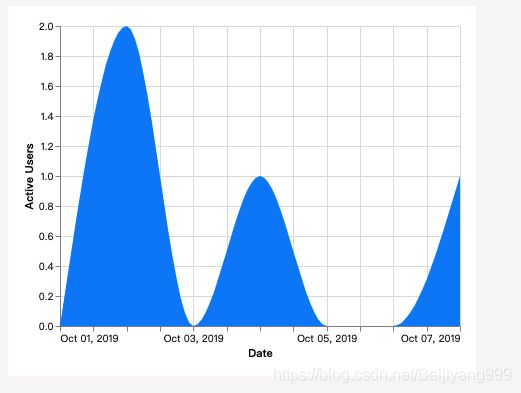
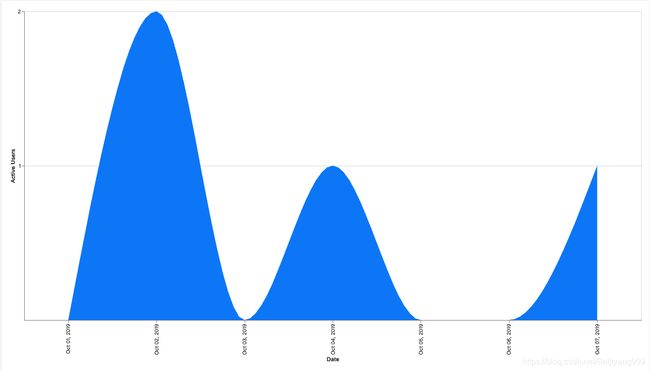
制作一个 area chart,表现国庆七天假期内的用户数量变化。
(可以粘贴到 Vega editor 中)
{
  "$schema": "https://vega.github.io/schema/vega-lite/v4.json",
  "mark": {"type": "area", "color": "#0084FF", "interpolate": "monotone"},
  "encoding": {
    "x": {
      "field": "date",
      "type": "temporal",
      "timeUnit": "yearmonthdate",
      "axis": {"title": "Date"}
    },
    "y": {
      "field": "active_users",
      "type": "quantitative",
      "axis": {"title": "Active Users"}
    },
    "opacity": {"value": 1}
  },
  "width": 400,
  "height": 300,
  "data": {
    "values": [
      {"active_users": 0, "date": "2019-10-01"},
      {"active_users": 2, "date": "2019-10-02"},
      {"active_users": 0, "date": "2019-10-03"},
      {"active_users": 1, "date": "2019-10-04"},
      {"active_users": 0, "date": "2019-10-05"},
      {"active_users": 0, "date": "2019-10-06"},
      {"active_users": 1, "date": "2019-10-07"}
    ]
  },
  "config": {}
}
Y 轴显示整数
看到这里,有人会问了,这什么产品这么惨,才这么点活跃用户数?
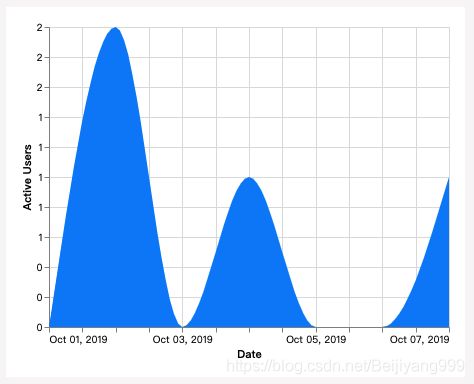
这里数据量写小是为了凸显 y 轴显示的问题。如果把用户数据改大,y 轴显示是很好看的,但如果数很小的话,如图,就会显示成小数。
显然,不存在半个,或者大半个用户,y 轴应该显示为整数。
通过查阅官方文档,有个 format 参数其中有 ‘d’ 可以设置为整数。
...
 "y": {
      "field": "active_users",
      "type": "quantitative",
      "axis": {
        "title": "Active Users",
        "format": "d"
        }
    },
...
这个时候,就需要使用 values 来直接指定。
...
 "y": {
      "field": "active_users",
      "type": "quantitative",
      "axis": {
        "title": "Active Users",
        "format": "d",
        "values": [1,2]
        }
    },
...
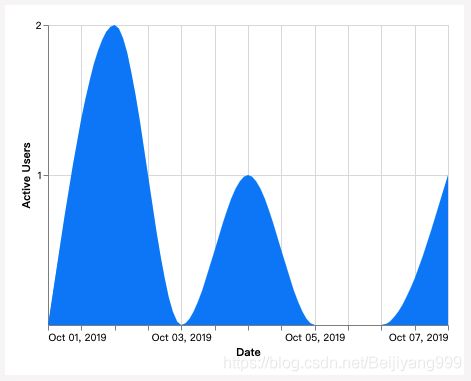
现在,y 轴成了我们想要的效果。显然,这里的 values 参数数组是随着数据变化的,我们可以在 React 组件中动态地传入,而且数组中不要 0,这样没数据时会显示空图表。
X 轴 时间轴的合理显示
现在再看时间轴的参数。field 指定了对应数据中的date,即按天显示,然后又通过 timeUnit 规定了显示格式。
另外还有个 type 参数,其值为 temporal。这个词本身意思和时间有关的,显示时间时常常用这个类型。
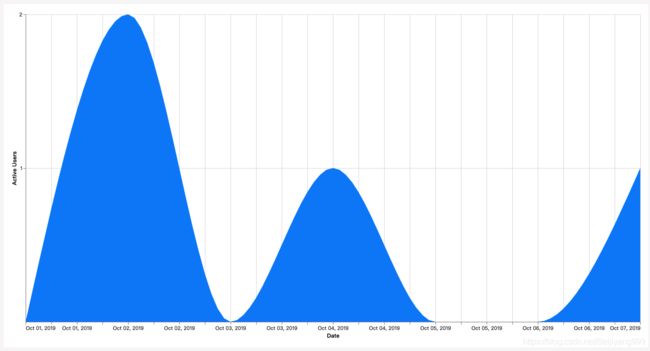
在数据量大的时候,显示效果是很好的,但当数据量小的时候,就会出现与刚才 y 轴类似的问题:重复的label。
例如下图,把长宽改大(web 端正常尺寸),就出现了重复显示的问题。
 "width": 1200,
 "height": 600,
此时,type 设为 ordinal 可以解决这个问题。
...
 "x": {
      "field": "date",
      "type": "ordinal",
      "timeUnit": "yearmonthdate",
      "axis": {"title": "Date"}
    },
...
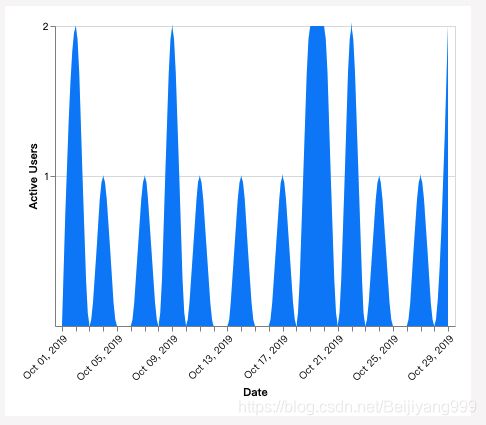
但当数据量大的时候,x 轴的 label 会挤到一起,黑压压一片。
 "values": [
      {"active_users": 0, "date": "2019-10-01"},
      {"active_users": 2, "date": "2019-10-02"},
      {"active_users": 0, "date": "2019-10-03"},
      {"active_users": 1, "date": "2019-10-04"},
      {"active_users": 0, "date": "2019-10-05"},
      {"active_users": 0, "date": "2019-10-06"},
      {"active_users": 1, "date": "2019-10-07"},
      {"active_users": 0, "date": "2019-10-08"},
      {"active_users": 2, "date": "2019-10-09"},
      {"active_users": 0, "date": "2019-10-10"},
      {"active_users": 1, "date": "2019-10-11"},
      {"active_users": 0, "date": "2019-10-12"},
      {"active_users": 0, "date": "2019-10-13"},
      {"active_users": 1, "date": "2019-10-14"},
      {"active_users": 0, "date": "2019-10-15"},
      {"active_users": 0, "date": "2019-10-16"},
      {"active_users": 1, "date": "2019-10-17"},
      {"active_users": 0, "date": "2019-10-18"},
      {"active_users": 2, "date": "2019-10-19"},
      {"active_users": 2, "date": "2019-10-20"},
      {"active_users": 0, "date": "2019-10-21"},
      {"active_users": 2, "date": "2019-10-22"},
      {"active_users": 0, "date": "2019-10-23"},
      {"active_users": 1, "date": "2019-10-24"},
      {"active_users": 0, "date": "2019-10-25"},
      {"active_users": 0, "date": "2019-10-26"},
      {"active_users": 1, "date": "2019-10-27"},
      {"active_users": 0, "date": "2019-10-28"},
      {"active_users": 2, "date": "2019-10-29"}
    ]
  },
所以,我们可以加一个条件判断,当数据范围超过一个月,type 设为 temporal, 反之用 ordinal。
为了用户的颈椎,再用 labelAngle 调整一下 x 轴 label 的角度。
const getDateXObj = rangeLen => ({
  field: 'date',
  type: `${rangeLen > 30 ? 'temporal' : 'ordinal'}`,
  timeUnit: 'yearmonthdate',
  axis: {
    title: 'Date',
    labelAngle: -45,
  },
});
如果仅仅是为了避免 label 排列过于密集,可读性差的问题,直接设置 labelAngle 就可以达到类似效果。
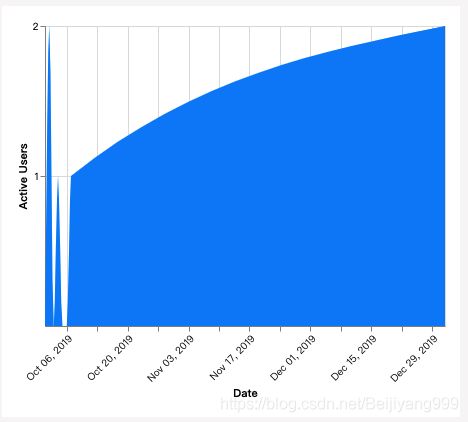
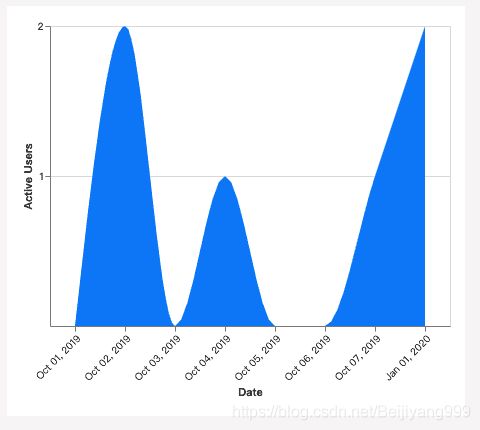
temporal 和 ordinal 的真正区别在于:
- 前者把数据放在不可压缩的时间轴上
- 后者仅对现有数据进行排列。
通过下面这两张图可以明显看出区别,注意数据,只是在之前 19 年国庆节的七天假期后面加了一天 20 年元旦。
 "values": [
      {"active_users": 0, "date": "2019-10-01"},
      {"active_users": 2, "date": "2019-10-02"},
      {"active_users": 0, "date": "2019-10-03"},
      {"active_users": 1, "date": "2019-10-04"},
      {"active_users": 0, "date": "2019-10-05"},
      {"active_users": 0, "date": "2019-10-06"},
      {"active_users": 1, "date": "2019-10-07"},
      {"active_users": 2, "date": "2020-01-01"} // happy new year~
    ]
在 React 项目中显示图表
我们使用 react-vega 包。首先,先显示最基本的图表:
装包
npm install react vega vega-lite react-vega --save
引入项目
...
import { Vega } from 'react-vega';
const spec = {
"$schema": "https://vega.github.io/schema/vega-lite/v4.json",
"mark": {"type": "area", "color": "#0084FF", "interpolate": "monotone"},
"encoding": {
"x": {
"field": "date",
"type": "ordinal",
"timeUnit": "yearmonthdate",
"axis": {
"title": "Date",
"labelAngle": -45
}
},
"y": {
"field": "active_users",
"type": "quantitative",
"axis": {
"title": "Active Users",
"format": "d",
"values": [1,2]
}
},
"opacity": {"value": 1}
},
"config": {}
}
const data = [
{"active_users": 0, "date": "2019-10-01"},
{"active_users": 2, "date": "2019-10-02"},
{"active_users": 0, "date": "2019-10-03"},
{"active_users": 1, "date": "2019-10-04"},
{"active_users": 0, "date": "2019-10-05"},
{"active_users": 0, "date": "2019-10-06"},
{"active_users": 1, "date": "2019-10-07"}
]
...
return (
...
然后,按上文所述,优化显示。
我们引入 getSpec 函数,用来返回 spec 对象。另外引入用来从 data 数组中取出最大值,以及创建 y 轴相应 values 参数值的函数。
...
const getSpec = (yAxisValues = [], rangeLen = 0) => ({
"$schema": "https://vega.github.io/schema/vega-lite/v4.json",
"mark": {"type": "area", "color": "#0084FF", "interpolate": "monotone"},
"encoding": {
"x": {
"field": "date",
type: `${rangeLen > 30 ? 'temporal' : 'ordinal'}`,
"timeUnit": "yearmonthdate",
"axis": {"title": "Date"}
},
"y": {
"field": "active_users",
"type": "quantitative",
"axis": {
"title": "Active Users",
"format": "d",
"values": yAxisValues
}
},
"opacity": {"value": 1}
},
"config": {}
})
...
function App() {
// get max value from data arary
const yAxisMaxValueFor = (...keys) => {
const maxList = keys.map(key => data.reduce((acc, cur) => (cur[key] > acc[key] ? cur : acc))[key]);
return Math.max(...maxList);
};
const yAxisValues = Array.from(
{ length: yAxisMaxValueFor('active_users') },
).map((v, i) => (i + 1));
const spec = getSpec(yAxisValues, data.length);
return (
至此,我们以及成功地在 React 项目中引入了 Vega-Lite 描述的图表。
图表右上角有个按钮,点击,出现了若干选项,支持导出下载,查看编译后的 Vega 配置,在 Vega 在线编辑器打开等功能。
显然,后面这些都是辅助开发的,我们希望仅对用户显示导出下载的选项。而且最好能指定下载的文件名(而非一个统一的默认名)。
这就体现了 React-Vega 的一个优点,它支持 Vega-Embed 的若干配置功能,详见文档。这里,我们只需要增加 actions,downloadFileName 两个配置。前者通过布尔值,仅打开导出功能,后者指定下载文件名。
...
最后,给 spec 对象中加入title:
  ...
  "title": '1024',
  ...
resize & legend
图表已经比较完善。作为在页面显示的完善,需要考虑到用户 resize 浏览器窗口大小的场景。
下一篇再谈这个吧。
最后,1024,好人一生… 不对,“程序员节”快乐。
?
更新
数据可视化:在 React 项目中使用 Vega 图表 (二):
- 多层图表;
- 图例;
- React 中使图表大小始终跟随浏览器窗口。

