移动端(APP、微信)混合开发下ECharts图横屏旋转
在移动开发中,图表是一种常见的数据统计形式,但是在手机有限的屏幕中实现图文结合,图标会显示不清晰,这时需要图表能够支持横向旋转功能,以angularJS下ECharts图表为例,通过如下代码即可实现旋转:
 var options = {
       animation: 'fade', // What animation to use
       rotateOption: $scope.barOption
 };
 mainNavi.pushPage($scope.baseUrl+'pagesV2/rotateEcharts/rotateEcharts.html', options);
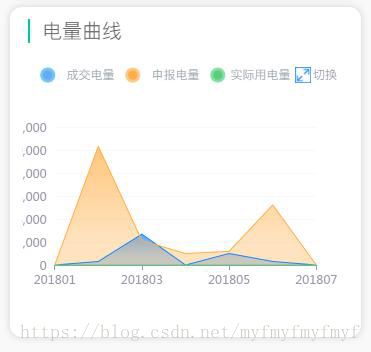
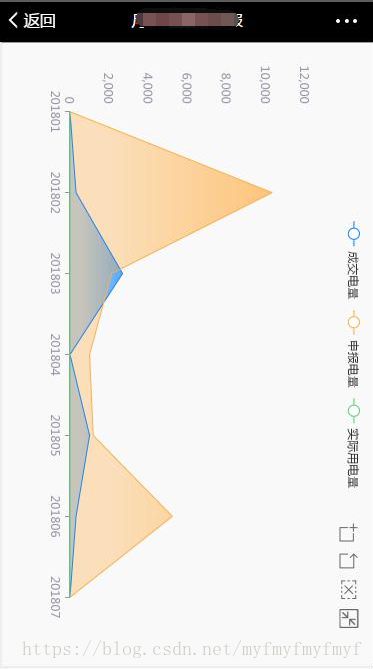
示例效果如下:
实现则是通过以下三个文件实现,实现组件化的Echarts图旋转
首先通过pushPage将数据传递给rotateEcharts.html页面,在rotateEcharts.html页面中嵌套iframe,iframe指向test.html页面,test页面则是旋转的echarts图,支持横线图标数据的点击与查看,不会出现X/Y轴数据未旋转的情况,已在APP、微信多个项目中应用。
----------------------------------------------------------------------------------------------------------------
--------------------------------------------------代码实现--------------------------------------------------
----------------------------------------------------------------------------------------------------------------
rotateEcharts.html页面,该页面是一个入门页面,内置Iframe而不是直接旋转主要为了解决“Echarts图旋转后X/Y轴坐标不选择问题”,该方式在Android、IOS、微信中都已经验证,五个上线的项目都正常使用,后续有问题持续更新中。。。
rotateEcharts.html页面控制器rotateEchartsController.js,原本是通过url传递数据,在后续的项目中发现数据过长导致的404问题,现通过localstory处理,同时处理旋转后X、Y轴数据异常问题、旧数据与新数据项目干扰的问题
app.controller('rotateEchartsController', ['$scope','$timeout','$hyHttp','$interval','$rootScope','$loginService',function($scope,$timeout,$hyHttp,$interval,$rootScope,$loginService){
$scope.init = function(){
$scope.rotateConfig = {
theme: 'shine',
dataLoaded: false
};
$scope.rotateOption = mainNavi.getCurrentPage().options.rotateOption;
/* $scope.rotateOption.tooltip.position = function (point, params, dom, rect, size){
console.log("point:",point);
console.log("params:",params);
console.log("dom:",dom);
console.log("rect:",rect);
console.log("size:",size);
// 固定在顶部
return [point[0], '10%'];
}*/
$scope.rotateConfig.dataLoaded = true;
$scope.isRotate = true;
}
// $scope.init();
$scope.init2 = function(){
$scope.rotateConfig = {
theme: 'shine',
dataLoaded: false
};
//克隆一个新对象,以防止影响上一页面信息
$scope.rotateOption = eval('(' + JSON.stringify(mainNavi.getCurrentPage().options.rotateOption) + ')');
$scope.rotateOption.legend.show=true;//显示图例
$scope.rotateOption.toolbox={
right:25,
itemSize:19,
feature: {
dataZoom: {},
brush: {
type: [ "clear"]
},
myTool2: {
show: true,
title: "切换",
icon: "image://../../img/zoomOut.png",
onclick: "tempStr"
}
}
};
var data = JSON.stringify( $scope.rotateOption);
data = data.replace('"tempStr"','function(){console.log(window.parent);window.parent.parentPop();localStorage.setItem("rotateEchartsData","");}')
var tat =angular.element(document.getElementById("myIframe"));
var innerHTML = '


