OpenCV-Python——第17.4章:轮廓的其他函数(凸缺陷,形状匹配,....)
目录
1 凸缺陷 2 Point Polygon Test 3 形状匹配
1 凸缺陷
前面我们已经学习了轮廓的凸包,对象上的任何凹陷都被成为凸缺陷。 OpenCV 中有一个函数 cv.convexityDefect() 可以帮助我们找到凸缺陷。函数调用如下:
hull = cv2.convexHull(cnt,returnPoints = False)
defects = cv2.convexityDefects(cnt,hull)
注意:如果要查找凸缺陷,在使用函数 cv2.convexHull 找凸包时,参数 returnPoints 一定要是 False。
其中:
下面这个函数用来检测一个曲线是否具有凸性缺陷,并能纠 正缺陷。一般来说,凸性曲线总是凸出来的,至少是平的。如果有地方凹进去 了就被叫做凸性缺陷。
cv2.convexHull(points, hull, clockwise, returnPoints)
- points: 我们要传入的轮廓
- hull: 输出,通常不需要
- clockwise: 方向标志。如果设置为 True,输出的凸包是顺时针方向的。 否则为逆时针方向。
- returnPoints: 默认值为 True。它会返回凸包上点的坐标。如果设置 为 False,就会返回与凸包点对应的轮廓上的点。
下面这个函数可以帮助我们找到凸缺陷
cv2.convexityDefect(contour, convexhull, convexityDefects)
- contour: 检测到的轮廓,可以调用findContours函数得到
- convexhull:检测到的凸包,可以调用convexHull函数得到。
- convexityDefects:输出参数,检测到的最终结果,返回一个数组,其中每一行包含的值是 [起点,终点,最远的点,到最远点的近似距离]。我们可以在一张图上显示它。我们将起点和终点用一条绿线 连接,在最远点画一个圆圈,要记住的是返回结果的前三个值是轮廓点的索引。 所以我们还要到轮廓点中去找它们。
2 Point Polygon Test
求解图像中的一个点到一个对象轮廓的最短距离。如果点在轮廓的外部, 返回值为负。如果在轮廓上,返回值为 0。如果在轮廓内部,返回值为正。
cv2.pointPolygonTest(contour, pt, measureDist)
- contour:轮廓可以调用findContours函数得到
- pt:测量点的坐标
- measureDist:如果设置为 True,就会计算最短距离。如果是 False,只会判断这个点与轮廓之间的位置关系(返回值为 +1,-1,0)。
对上面两节举个例子:
import cv2
import numpy as np
from matplotlib import pyplot as plt

font = cv2.FONT_HERSHEY_SIMPLEX  # 设置字体样式

img = cv2.imread('test21_4.jpg')
imgray = cv2.cvtColor(img, cv2.COLOR_BGR2GRAY)
ret, thresh = cv2.threshold(imgray, 127, 255, 0)
image, contours, hierarchy = cv2.findContours(thresh, cv2.RETR_TREE, cv2.CHAIN_APPROX_SIMPLE)
cnt = contours[0]
hull = cv2.convexHull(cnt, returnPoints=False)
defects = cv2.convexityDefects(cnt, hull)

for i in range(defects.shape[0]):
    s, e, f, d = defects[i, 0]
    start = tuple(cnt[s][0])
    end = tuple(cnt[e][0])
    far = tuple(cnt[f][0])
    cv2.line(img, start, end, [0, 255, 0], 2)
    cv2.circle(img, far, 5, [0, 0, 255], -1)

inside = (190, 190)
outside = (50, 50)

img0 = img.copy()
dist1 = cv2.pointPolygonTest(cnt, outside, True)
cv2.circle(img0, outside, 5, [255, 255, 0], -1)
text = 'Point Ploygon Test: ' + str(round(dist1, 2))
cv2.putText(img0, text, (10, 30), font, 0.8, (0, 255, 0), 1, cv2.LINE_AA, 0)

img1 = img.copy()
dist2 = cv2.pointPolygonTest(cnt, inside, True)
cv2.circle(img1, inside, 5, [255, 255, 0], -1)
text = 'Point Ploygon Test: ' + str(round(dist2, 2))
cv2.putText(img1, text, (10, 30), font, 0.8, (0, 255, 0), 1, cv2.LINE_AA, 0)

img2 = img.copy()
dist3 = cv2.pointPolygonTest(cnt, outside, False)
cv2.circle(img2, outside, 5, [255, 255, 0], -1)
text = 'Point Ploygon Test: ' + str(dist3)
cv2.putText(img2, text, (10, 30), font, 0.8, (0, 255, 0), 1, cv2.LINE_AA, 0)

img3 = img.copy()
dist4 = cv2.pointPolygonTest(cnt, inside, False)
cv2.circle(img3, inside, 5, [255, 255, 0], -1)
text = 'Point Ploygon Test: ' + str(dist4)
cv2.putText(img3, text, (10, 30), font, 0.8, (0, 255, 0), 1, cv2.LINE_AA, 0)

plt.subplot(221), plt.imshow(cv2.cvtColor(img0, cv2.COLOR_BGR2RGB)), plt.title('Pole')
plt.subplot(222), plt.imshow(cv2.cvtColor(img1, cv2.COLOR_BGR2RGB)), plt.title('Rectangle')
plt.subplot(223), plt.imshow(cv2.cvtColor(img2, cv2.COLOR_BGR2RGB)), plt.title('Rectangle')
plt.subplot(224), plt.imshow(cv2.cvtColor(img3, cv2.COLOR_BGR2RGB)), plt.title('Circle')
plt.show()
结果如下:
3 形状匹配
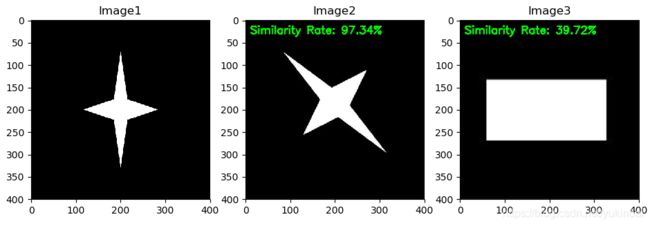
函数 cv2.matchShape() 可以帮我们比较两个形状或轮廓的相似度。如果返回值越小,匹配越好。它是根据 Hu 矩来计算的。
Hu矩可参考:http://blog.csdn.net/wrj19860202/article/details/6327094
由Hu矩组成的特征量对图片进行识别,优点就是速度很快,缺点是识别率比较低,我做过手势识别,对于已经分割好的手势轮廓图,识别率也就30%左右,对于纹理比较丰富的图片,识别率更是不堪入眼,只有10%左右。这一部分原因是由于Hu不变矩只用到低阶矩(最多也就用到三阶矩),对于图像的细节未能很好的描述出来,导致对图像的描述不够完整。
cv2.matchShape(contour1, contour2, method, parameter)
- contour1:待匹配轮廓1
- contour2:待匹配轮廓2
- method:匹配方法可以有以下三种
CONTOURS_MATCH_I1
CONTOURS_MATCH_I2
CONTOURS_MATCH_I3
- parameter:默认为0
举一个例子:
import cv2
import numpy as np
from matplotlib import pyplot as plt

font = cv2.FONT_HERSHEY_SIMPLEX  # 设置字体样式

img1 = cv2.imread('test21_4.jpg')
imgray1 = cv2.cvtColor(img1, cv2.COLOR_BGR2GRAY)
img2 = cv2.imread('test21_4_1.jpg')
imgray2 = cv2.cvtColor(img2, cv2.COLOR_BGR2GRAY)
img3 = cv2.imread('test21_1.jpg')
imgray3 = cv2.cvtColor(img3, cv2.COLOR_BGR2GRAY)

ret, thresh1 = cv2.threshold(imgray1, 127, 255, 0)
ret, thresh2 = cv2.threshold(imgray2, 127, 255, 0)
ret, thresh3 = cv2.threshold(imgray3, 127, 255, 0)

image, contours, hierarchy = cv2.findContours(thresh1, cv2.RETR_TREE, cv2.CHAIN_APPROX_SIMPLE)
cnt1 = contours[0]
image, contours, hierarchy = cv2.findContours(thresh2, cv2.RETR_TREE, cv2.CHAIN_APPROX_SIMPLE)
cnt2 = contours[0]
image, contours, hierarchy = cv2.findContours(thresh3, cv2.RETR_TREE, cv2.CHAIN_APPROX_SIMPLE)
cnt3 = contours[0]

match1 = cv2.matchShapes(cnt1, cnt2, 1, 0.0)
text = 'Similarity Rate: ' + str(100 - round(match1, 4)*100) + '%'
cv2.putText(img2, text, (10, 30), font, 0.8, (0, 255, 0), 1, cv2.LINE_AA, 0)

match2 = cv2.matchShapes(cnt1, cnt3, 1, 0.0)
text = 'Similarity Rate: ' + str(100 - round(match2, 4)*100) + '%'
cv2.putText(img3, text, (10, 30), font, 0.8, (0, 255, 0), 1, cv2.LINE_AA, 0)

plt.subplot(131), plt.imshow(cv2.cvtColor(img1, cv2.COLOR_BGR2RGB)), plt.title('Image1')
plt.subplot(132), plt.imshow(cv2.cvtColor(img2, cv2.COLOR_BGR2RGB)), plt.title('Image2')
plt.subplot(133), plt.imshow(cv2.cvtColor(img3, cv2.COLOR_BGR2RGB)), plt.title('Image3')
plt.show()
结果如下

