Visualize almost anything with Grafana and Python
There are a lot of people who would like to use Grafana to visualize SQLite. This blog post will allow you to do just that with Python. The Python Standard Library includes a driver for SQLite
First, go ahead and install Grafana (if you have not done so already), and install the plugin simple-json-datasource. This allows you to add a data-source from a web server that returns specially crafted JSON. The documentation on Grafana's website is a bit sparse, so here is a thorough guide how to build a web server to that serves this JSON.
First go and grab bottle.py put it in a directory where you create a python file called data-source.py. In this file we create a simple web server using bottle:
from bottle import Bottle, HTTPResponse, run, request, response

app = Bottle()

@app.get("/")
def index():
    return "OK"

if __name__ == '__main__':
    run(app=app, host='localhost', port=8081)
You can now run the server:
$ python3 pds.py
Bottle v0.13-dev server starting up (using WSGIRefServer())...
Listening on http://localhost:8081/
Hit Ctrl-C to quit.
A few things to note here, bottle is extremely stable although this is the dev version. You can safely use this. Another thing here is that I am using the default WSGIRefServer, don't use this in production and please deploy your application with uWSGI (or Gunicorn if you must).
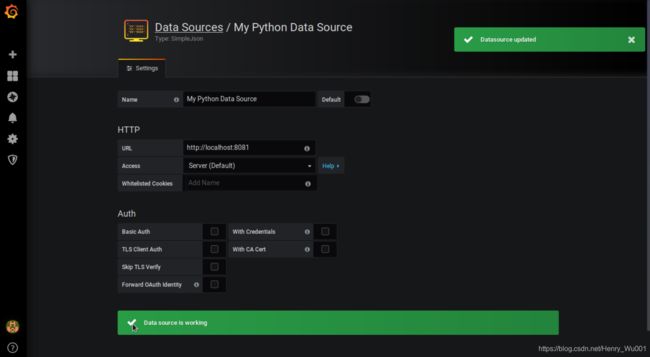
Now in Grafana you will be able to add this data source, and it should be marked as good to use.
docker grafana安装插件:
docker run \
  -d \
  -p 3000:3000 \
  --name=grafana \
  -e "GF_INSTALL_PLUGINS=grafana-clock-panel,grafana-simple-json-datasource" \
  grafana/grafana
The documentation specifies you should enable CORS, so before adding anything to the webserver, let's enable CORS:
@app.hook('after_request')
def enable_cors():
    print("after_request hook")
    response.headers['Access-Control-Allow-Origin'] = '*'
    response.headers['Access-Control-Allow-Methods'] = 'OPTIONS'
    response.headers['Access-Control-Allow-Headers'] = 'Accept, Content-Type'
The next step is to add a /search endpoint which appears as the find metric options on the query tab in panels. This endpoint should return a JSON array with the names of the data series available, for example:
["series A", "series B"]
Per default returning a dictionary from an end in bottle will result in a valid JSON. Creating a JSON array with bottle is a little more involved. To this we create an instance of HTTPResponse with headers that specify that this is response is JSON. The body is a dump of a Python list.
from bottle import json_dumps


@app.post('/search')
def search():
    return HTTPResponse(body=json_dumps(['series A', 'series B']),
                            headers={'Content-Type': 'application/json'})
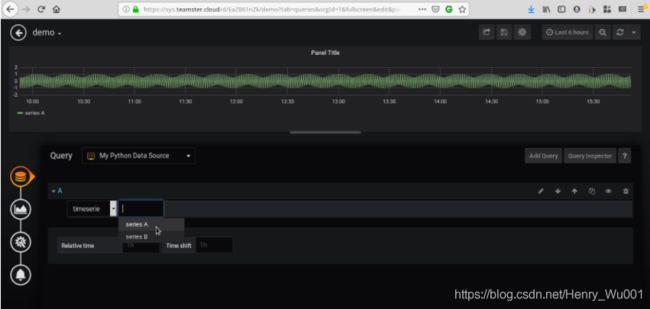
Also, note that, the code uses json_dumps from bottle and not json.dumps. This is because json.dumps slow and bottle is opting to use usjon.dumps for speed if this module is installed. Now it is possible to choose one of two series:
The next step is to add the /query endpoint. This one is a bit trickier, because this end point can return either time-series data or a table for each series. I will start with the later case.
Grafana sends a request which specifies that it queries for the tabular data. The request's JSON will contain:
'targets': [{'target': 'series B', 'refId': 'A', 'type': 'table'}]
So the endpoint has to check for it in order to return a response which Grafana can understand:
@app.post('/query'):

    if request.json['targets'][0]['type'] == 'table':
        series = request.json['targets'][0]['target']
        ...
Also, note, that we extract the name of the series from the request. Now we can return something that Grafana can understand. We take the example from the documentation, and add a little twist, so there is a table for each series:
@app.post('/query')
def query():
    if request.json['targets'][0]['type'] == 'table':
        series = request.json['targets'][0]['target']
        bodies = {'series A': [{
        "columns":[
          {"text":"Time","type":"time"},
          {"text":"Country","type":"string"},
          {"text":"Number","type":"number"}
        ],
        "rows":[
          [1234567,"SE",123],
          [1234567,"DE",231],
          [1234567,"US",321]
        ],
        "type":"table"
        }], 'series B': [{
        "columns":[
          {"text":"Time","type":"time"},
          {"text":"Country","type":"string"},
          {"text":"Number","type":"number"}
        ],
        "rows":[
          [1234567,"BE",123],
          [1234567,"GE",231],
          [1234567,"PS",321]
        ],
        "type":"table"
        }]}

        series = request.json['targets'][0]['target']
        body = json_dumps(bodies[series])
        return HTTPResponse(body=body,
                            headers={'Content-Type': 'application/json'})
Now you can switch between both tables:
The next step is to extend /query so that it requerns time series data. Grafana expects the data in the following form:
[
  {
    "target":"series A", // The field being queried for
    "datapoints":[
      [622,1450754160000],  // Metric value as a float , unixtimestamp in milliseconds
      [365,1450754220000]
    ]
  },
  {
    "target":"series B",
    "datapoints":[
      [861,1450754160000],
      [767,1450754220000]
    ]
  }
]
The respons sent contains information inlcuding the name of the series, the start and end points. The datapoints are a list of value and unixtimestamp in milliseconds. This unixtimestamp in milliseconds isn't an usuall choice for databases and as mentioned before there is no native date type for SQLite so you will have to convert what ever format your datetime data is stored to this specific format. To create the rest of this endpoint, I will be manuvaring away from database specific, and I am going to create a simple array of values using the Sine and Cosine function (you should be able to read real data from your favorite database instead of these functions).
@app.post('/query')
def query():
      if request.json['targets'][0]['type'] == 'table':
                ... snipped ...
    else:
        body = []
        start, end = request.json['range']['from'], request.json['range']['to']
        for target in request.json['targets']:
            name = target['target']
            datapoints = create_data_points(FUNCTIONS[name], start, end)
            body.append({'target': name, 'datapoints': datapoints})

        body = dumps(body)
    return HTTPResponse(body=body, headers={'Content-Type': 'application/json'})
The hard work is hidden in create_data_points. This function takes care of creating an array of values and unixtimestamp in milliseconds. If you inteand to query a real database you should replace this with real code. Here is the code for create_data_points:
import math

from datetime import datetime
from calendar import timegm

FUNCTIONS = {'series A': math.sin, 'series B': math.cos}

def convert_to_time_ms(timestamp):
    """Convert a Grafana timestamp to unixtimestamp in milliseconds

        Args:
            timestamp (str): the request contains ``'range': {'from':
                   '2019-06-16T08:00:05.331Z', 'to': '2019-06-16T14:00:05.332Z', ...``
        """
    return 1000 * timegm(datetime.strptime(timestamp, '%Y-%m-%dT%H:%M:%S.%fZ').timetuple())

def create_data_points(func, start, end, length=1020):
    """
        A dummy function to produce sine and cosine data

        You should replace this with your SQL, CQL or Mongo Query language.
        Also, make sure your database has the correct indecies to increase perfomance

        Args:
          func (object) - A callable that accepts a number and returns a number
            start (str) - timestamp
            end (str) - timestamp
            length (int) - the number of data points

        """
    lower = convert_to_time_ms(start)
    upper = convert_to_time_ms(end)
    return [[func(i), int(i)] for i in [lower + x*(upper-lower)/length for x in range(length)]]
Finally, I am a huge fan of SQLite, and it's my goto Relational Database in most of my Projects. Nevertheless, you should consider whether a Relational Database is the right choice for storing time series data. I would not be a huge problem for smaller amounts of data. However, for larger datasets and intesive queries, you should consider a dedicated time series database.
The complete code for creating a grafana data source with python can be found here.
Credits:
- Bottle Py: Enabling CORS for jQuery AJAX requests
- Making a list of evenly spaced numbers in a certain range in python
- Creating a Grafana datasource using Flask and the Simple JSON datasource plugin


