you’re going to learn all about breakpoints and how to create them using LLDB.
Unix signals are a basic form of interprocess communication. For example, one of the signals, SIGSTOP, can be used to save the state and pause execution of a process, while its counterpart, SIGCONT, is sent to a program to resume execution. Both of these signals can be used by a debugger to pause and continue a program’s execution.
(lldb) c
Process 38372 resuming
This is an interesting application on several fronts, because it not only explores Unix signal handling, but also highlights what happens when a controlling process (LLDB) handles the passing of Unix signals to the controlled process. By default, LLDB has custom actions for handling different signals. Some signals are not passed onto the controlled process while LLDB is attached.
(lldb) c
Process 38372 resuming
2017-10-23 16:26:55.324 Signals[38372:1605989] Appending new signal: SIGSTOP
By default, LLDB has custom actions for handling different signals. Some signals are not passed onto the controlled process while LLDB is attached.
In order to display a signal, you can either raise a Signal from within the application, or send a signal externally from a different application, like Terminal.
In addition, there’s a UISwitch that toggles the signal handling blocking, which calls the C function sigprocmask to disable or enable the signal handlers.
Finally, the Signal application has a Timeout bar button which raises the SIGSTOP signal from within the application, essentially “freezing” the program. However, if LLDB is attached to the Signals program (and by default it will be, when you build and run through Xcode), calling SIGSTOP will allow you to inspect the execution state with LLDB while in Xcode.
Build and run the app. Once the project is running, navigate to the Xcode console and pause the debugger.
Resume Xcode and keep an eye on the Simulator. A new row will be added to the UITableView whenever the debugger stops then resumes execution. This is achieved by Signals monitoring the SIGSTOP Unix signal event and adding a row to the data model whenever it occurs. When a process is stopped, any new signals will not be immediately processed because the program is sort of, well, stopped.
Xcode breakpoints
Symbolic breakpoints are a great debugging feature of Xcode.
You’re now going to try using a symbolic breakpoint to show all the instances of NSObject being created.
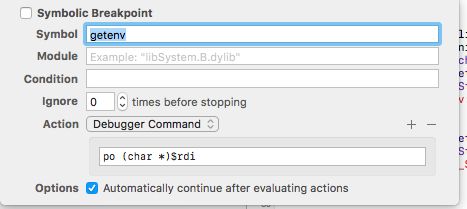
switch to the Breakpoint Navigator. In the bottom left, click the plus button to select the Symbolic Breakpoint... option.
popup will appear. In the Symbol part of the popup type: -[NSObject init]. Under Action, select Add Action and then select Debugger Command from the dropdown. Next, enter po [$arg1 class] in the box below.
Finally, select Automatically continue after evaluating actions.
Exception Breakpoint
Swift Error Breakpoint


