Python交互式数据分析报告框架——Dash
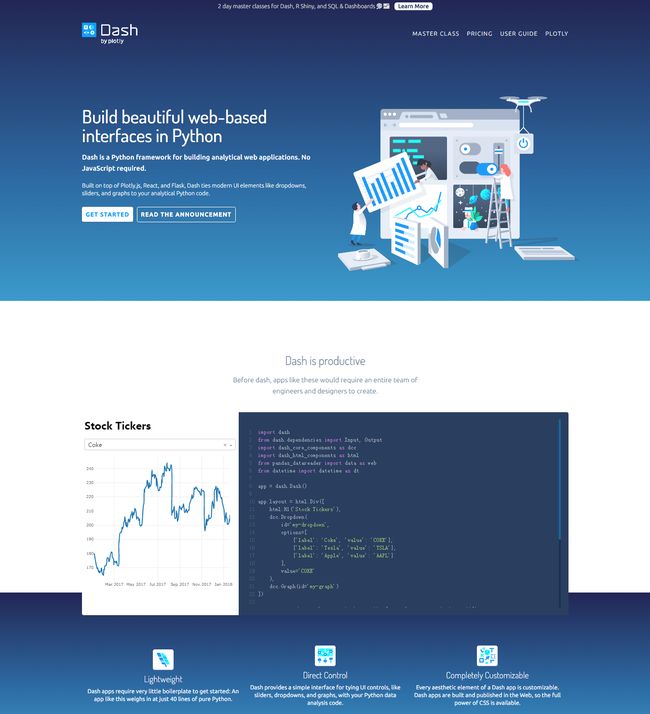
Dash是一个基于Web应用程序、用于分析的Python库,开发时间已达两年之久。最初,Plotly在GitHub上公布了Dash的概念验证,经过长时间不间断的开发,Plotly发布了作为企业级解决方案和开源工具的Dash。Dash项目可用于数据分析、数据挖掘、可视化、建模、仪器控制和报告。这是一个轻量级的项目,只有40行Python,并且提供了一个用于键入UI控件的界面,包含滑块,下拉列表和带代码的图形等等。最重要的是Dash是完全可定制化的。
有企业曾表示,我们与Dash Enterprise的目标是在内部共享Dash应用程序,无需开发人员,尽可能简单和安全。Dash Enterprise负责URL路由、监控、故障处理、部署、版本控制和程序包管理。用户可以在本地无限制的使用开源版本,也可以通过Heroku或Digital Ocean等平台管理Dash应用程序的部署。
Plotly公司在Dash项目网站上写道:Explore data, tweak your models, monitor your experiments, or roll your own business intelligence platform. Dash is the front-end to your analytical Python backend。(来自搜狐科技)
关于具体介绍可参见作者Plotly,Chris Pamer写的内容,原文链接:
https://link.jianshu.com/?t=https%3A%2F%2Fmedium.com%2F%40plotlygraphs%2Fintroducing-dash-5ecf7191b503
下面是一个将下拉菜单与支持D3.js的Plotly图形结合的Dash应用。用户通过筛选下拉菜单来选择不同的值,程序代码就能动态地从谷歌金融导入数据到Pandas的DataFrame。然而,这个应用仅用了43行代码!
Dash应用:Hello World,更多请查阅用户指南
下面是官网上的一个超级精彩的交互式界面的例子:
import dash
from dash.dependencies import Input, Output
import dash_core_components as dcc
import dash_html_components as html
from plotly import graph_objs as go
from datetime import datetime as dt
import json
import pandas as pd

df_fund_data = pd.read_csv('https://plot.ly/~jackp/17534.csv')
df_fund_data.head()

df_perf_summary = pd.read_csv('https://plot.ly/~jackp/17530.csv')
df_perf_summary.head()

df_cal_year = pd.read_csv('https://plot.ly/~jackp/17528.csv')
df_cal_year.head()

df_perf_pc = pd.read_csv('https://plot.ly/~jackp/17532.csv')

def make_dash_table( df ):
    ''' Return a dash definitio of an HTML table for a Pandas dataframe '''
    table = []
    for index, row in df.iterrows():
        html_row = []
        for i in range(len(row)):
            html_row.append( html.Td([ row[i] ]) )
        table.append( html.Tr( html_row ) )
    return table

modifed_perf_table = make_dash_table( df_perf_summary )

modifed_perf_table.insert(
    0, html.Tr( [
            html.Td([]),
            html.Td(['Cumulative'], colSpan=4, style=dict(textAlign="center")),
            html.Td(['Annualised'], colSpan=4, style=dict(textAlign="center"))
        ], style = dict( background='white', fontWeight=600 )
    )
)

df_fund_info = pd.read_csv('https://plot.ly/~jackp/17544.csv')
df_fund_characteristics = pd.read_csv('https://plot.ly/~jackp/17542.csv')
df_fund_facts = pd.read_csv('https://plot.ly/~jackp/17540.csv')
df_bond_allocation = pd.read_csv('https://plot.ly/~jackp/17538.csv')

dash.__version__

app = dash.Dash('GS Bond II Portfolio')
# Describe the layout, or the UI, of the app
app.layout = html.Div([

    html.Div([ # page 1

        html.A([ 'Print PDF' ],
           className="button no-print",
           style=dict(position="absolute", top=-40, right=0)),

        html.Div([ # subpage 1

            # Row 1 (Header)

            html.Div([

                html.Div([
                    html.H5('Goldman Sachs Strategic Absolute Return Bond II Portfolio'),
                    html.H6('A sub-fund of Goldman Sachs Funds, SICAV', style=dict(color='#7F90AC')),
                    ], className = "nine columns padded" ),

                html.Div([
                    html.H1([html.Span('03', style=dict(opacity=0.5)), html.Span('17')]),
                    html.H6('Monthly Fund Update')
                ], className = "three columns gs-header gs-accent-header padded", style=dict(float='right') ),

            ], className = "row gs-header gs-text-header"),

            html.Br([]),

            # Row 2

            html.Div([

                html.Div([
                    html.H6('Investor Profile', className = "gs-header gs-text-header padded"),

                    html.Strong('Investor objective'),
                    html.P('Capital appreciation and income.', className = 'blue-text'),

                    html.Strong('Position in your overall investment portfolio*'),
                    html.P('The fund can complement your portfolio.', className = 'blue-text'),

                    html.Strong('The fund is designed for:'),
                    html.P('The fund is designed for investors who are looking for a flexible \
                            global investment and sub-investment grade fixed income portfolio \
                            that has the ability to alter its exposure with an emphasis on interest \
                            rates, currencies and credit markets and that seeks to generate returns \
                            through different market conditions with a riskier investment strategy \
                            than GS Strategic Absolute Return Bond I Portfolio.', className = 'blue-text' ),

                ], className = "four columns" ),

                html.Div([
                    html.H6(["Performance (Indexed)"],
                            className = "gs-header gs-table-header padded"),
                    html.Iframe(src="https://plot.ly/~jackp/17553.embed?modebar=false&link=false&autosize=true", \
                            seamless="seamless", style=dict(border=0), width="100%", height="250")
                ], className = "eight columns" ),

            ], className = "row "),

            # Row 2.5

            html.Div([

                html.Div([
                    html.H6('Performance (%)', className = "gs-header gs-text-header padded"),
                    html.Table( make_dash_table( df_perf_pc ), className = 'tiny-header' )
                ], className = "four columns" ),

                html.Div([
                    html.P("This is an actively managed fund that is not designed to track its reference benchmark. \
                        Therefore the performance of the fund and the performance of its reference benchmark \
                        may diverge. In addition stated reference benchmark returns do not reflect any management \
                        or other charges to the fund, whereas stated returns of the fund do."),
                    html.Strong("Past performance does not guarantee future results, which may vary. \
                        The value of investments and the income derived from investments will fluctuate and \
                        can go down as well as up. A loss of capital may occur.")
                ], className = "eight columns" ),

            ], className = "row "),

            # Row 3

            html.Div([

                html.Div([
                    html.H6('Fund Data', className = "gs-header gs-text-header padded"),
                    html.Table( make_dash_table( df_fund_data ) )
                ], className = "four columns" ),

                html.Div([
                    html.H6("Performance Summary (%)", className = "gs-header gs-table-header padded"),
                    html.Table( modifed_perf_table, className = "reversed" ),

                    html.H6("Calendar Year Performance (%)", className = "gs-header gs-table-header padded"),
                    html.Table( make_dash_table( df_cal_year ) )
                ], className = "eight columns" ),

            ], className = "row "),

        ], className = "subpage" ),

    ], className = "page" ),

    html.Div([ # page 2

        html.A([ 'Print PDF' ],
           className="button no-print",
           style=dict(position="absolute", top=-40, right=0)),

        html.Div([ # subpage 2

            # Row 1 (Header)

            html.Div([

                html.Div([
                    html.H5('Goldman Sachs Strategic  Absolute Return Bond II Portfolio'),
                    html.H6('A sub-fund of Goldman Sachs Funds, SICAV', style=dict(color='#7F90AC')),
                    ], className = "nine columns padded" ),

                html.Div([
                    html.H1([html.Span('03', style=dict(opacity=0.5)), html.Span('17')]),
                    html.H6('Monthly Fund Update')
                ], className = "three columns gs-header gs-accent-header padded", style=dict(float='right') ),

            ], className = "row gs-header gs-text-header"),

            # Row 2

            html.Div([

                # Data tables on this page:
                # ---
                # df_fund_info = pd.read_csv('https://plot.ly/~jackp/17544/.csv')
                # df_fund_characteristics = pd.read_csv('https://plot.ly/~jackp/17542/.csv')
                # df_fund_facts = pd.read_csv('https://plot.ly/~jackp/17540/.csv')
                # df_bond_allocation = pd.read_csv('https://plot.ly/~jackp/17538/')

                # Column 1

                html.Div([
                    html.H6('Financial Information', className = "gs-header gs-text-header padded"),
                    html.Table( make_dash_table( df_fund_info ) ),

                    html.H6('Fund Characteristics', className = "gs-header gs-text-header padded"),
                    html.Table( make_dash_table( df_fund_characteristics ) ),

                    html.H6('Fund Facts', className = "gs-header gs-text-header padded"),
                    html.Table( make_dash_table( df_fund_facts ) ),

                ], className = "four columns" ),

                # Column 2

                html.Div([
                    html.H6('Sector Allocation (%)', className = "gs-header gs-table-header padded"),
                    html.Iframe(src="https://plot.ly/~jackp/17560.embed?modebar=false&link=false&autosize=true", \
                        seamless="seamless", style=dict(border=0), width="100%", height="300"),

                    html.H6('Country Bond Allocation (%)', className = "gs-header gs-table-header padded"),
                    html.Table( make_dash_table( df_bond_allocation ) ),

                ], className = "four columns" ),

                # Column 3

                html.Div([
                    html.H6('Top 10 Currency Weights (%)', className = "gs-header gs-table-header padded"),
                    html.Iframe(src="https://plot.ly/~jackp/17555.embed?modebar=false&link=false&autosize=true", \
                        seamless="seamless", style=dict(border=0), width="100%", height="300"),

                    html.H6('Credit Allocation (%)', className = "gs-header gs-table-header padded"),
                    html.Iframe(src="https://plot.ly/~jackp/17557.embed?modebar=false&link=false&autosize=true", \
                        seamless="seamless", style=dict(border=0), width="100%", height="300"),

                ], className = "four columns" ),

            ], className = "row"),

        ], className = "subpage" ),

    ], className = "page" ),

])


external_css = [ "https://cdnjs.cloudflare.com/ajax/libs/normalize/7.0.0/normalize.min.css",
        "https://cdnjs.cloudflare.com/ajax/libs/skeleton/2.0.4/skeleton.min.css",
        "//fonts.googleapis.com/css?family=Raleway:400,300,600",
        "https://codepen.io/plotly/pen/KmyPZr.css",
        "https://maxcdn.bootstrapcdn.com/font-awesome/4.7.0/css/font-awesome.min.css"]

for css in external_css:
    app.css.append_css({ "external_url": css })

external_js = [ "https://code.jquery.com/jquery-3.2.1.min.js",
        "https://codepen.io/plotly/pen/KmyPZr.js" ]

for js in external_js:
    app.scripts.append_script({ "external_url": js })

app.server.run()
#* Running on http://127.0.0.1:5000/ (Press CTRL+C to quit)
运行:
[外链图片转存失败(img-XnwpQUPd-1568125888715)(https://img-blog.csdn.net/20180120174130214)]