C# 学习笔记六 WinForm Chart类
【207】WinForm Chart类
目录:
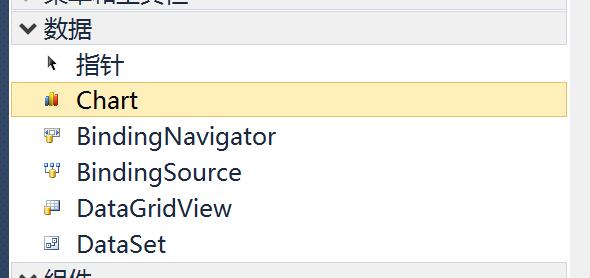
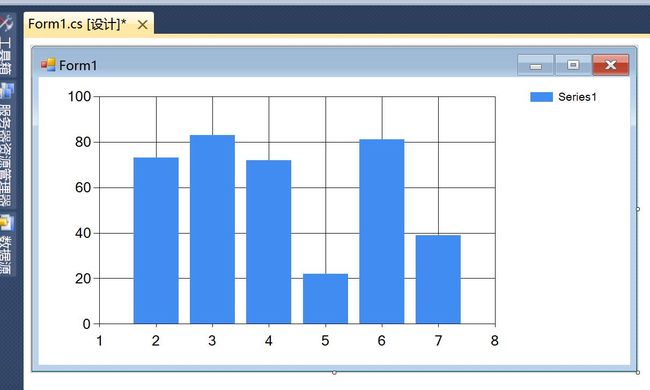
- 在工具箱中找到 Chart 控件并使用
- 设置 Chart 属性
- 代码中设置属性
- 属性中设置属性
- Chart 类说明
- ChartAreas
- ChartAreaCollection 类
- ChartArea 类
- Axis 类
- Grid 类
- Series
- SeriesCollection 类
- Series 类
- DataPointCollection 类
- DataPoint 类
- Titles
- TitleCollection 类
- Title 类
- ChartAreas
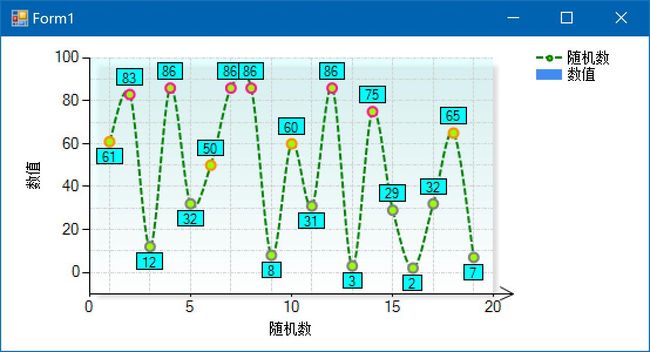
先简单说一下,从图中可以看到一个 Chart 可以绘制多个 ChartArea,每个 ChartArea 都可以绘制多条 Series。ChartArea 就是就是绘图区域,可以有多个 ChartArea 叠加在一起,Series 是画在 ChartAarea 上的,Series 英文意思是“序列、连续”,其实就是数据线,它可以是曲线、点、柱形、条形、饼图...可以注意该 Chart 当数据非常多的时候可以通过鼠标选择查看区域,进一步拖拽横纵向滚动条来缩小曲线图查看。
Chart.ChartAreas 属性:获取用于存储 ChartArea 对象的只读 ChartAreaCollection 对象。ChartArea 对象用于绘制一个或多个图表。
Chart.Series 属性:获取 SeriesCollection 对象。Series 对象存储 DataPoint 的对象,以及数据特性。
参考:C# MSChart图表控件使用介绍
1. 在工具箱中找到 Chart 控件并使用
2. 设置 Chart 属性
设置MSChart控件属性方法两种:1)代码中设置属性;2)属性表设置属性
| 1 2 3 4 5 6 7 8 9 10 11 12 13 14 15 16 17 18 19 20 21 22 23 24 25 26 27 28 29 30 31 32 33 34 35 36 37 38 39 40 41 42 43 44 45 46 47 48 49 50 51 52 53 54 55 56 57 58 59 60 61 62 63 64 65 |
|
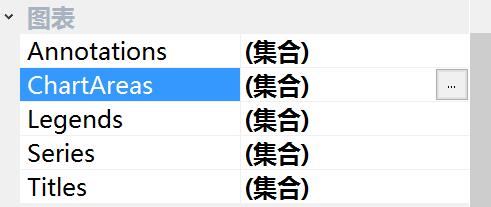
2)属性中设置属性:
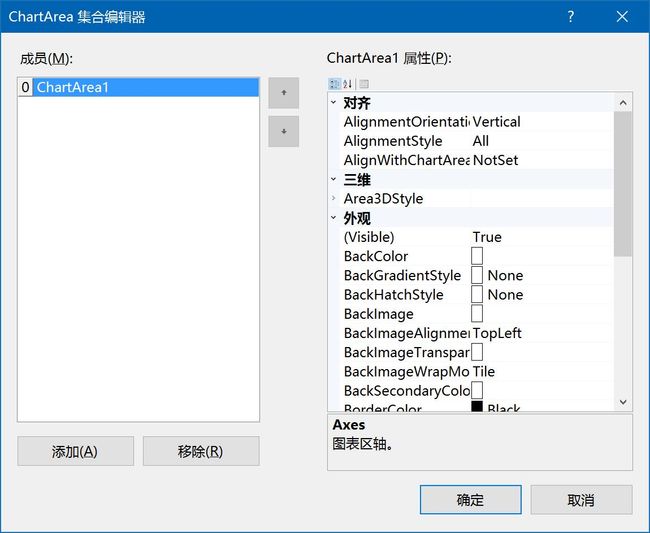
步骤1:设置ChartArea属性
点击ChartAreas(集合)后面的小按钮进入对话框,设置对应的属性
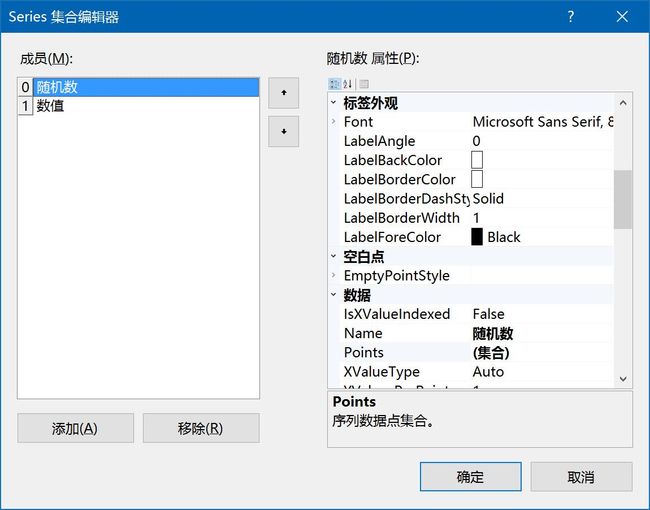
步骤2:设置Series属性
点击Series(集合)后面的小按钮进入对话框,设置对应属性
3. Chart 类说明
- ChartAreas:获取用于存储 ChartArea 对象的只读 ChartAreaCollection 对象。
- ChartAreaCollection 类:表示 ChartArea 对象的集合。
- Count:获取 Collection
中实际包含的元素数。 - Item[Int32]:获取或设置指定索引处的元素。
- Item[String]:获取或设置具有指定名称的图表元素。
- Count:获取 Collection
- ChartArea 类:表示图表图像上的图表区域。
- AxisX:获取或设置表示主 X 轴的 Axis 对象。
- AxisY:获取或设置表示主 Y 轴的 Axis 对象。
- BackColor:获取或设置 ChartArea 对象的背景色。
- BackGradientStyle:获取或设置图表区域的背景渐变方向,还确定是否使用渐变。
- ShadowColor:获取或设置 ChartArea 对象的阴影颜色。
- ShadowOffset:获取或设置 ChartArea 对象的阴影偏移量(以像素为单位)。
- Axis 类:提供管理 Chart 控件中的轴的方法和属性。
- MajorGrid:获取或设置用于设置轴的主要网格线属性的 Grid 对象。
- Title:获取或设置轴的标题。
- ArrowStyle:获取或设置二维轴的箭头样式;此样式不适用于三维图表区域。
- Interval:获取或设置轴的间隔。(坐标轴数据间隔)
- IntervalOffset:获取或设置轴的间隔偏移量。(坐标轴第一个数据距离原点的间隔)
- Maximum:获取或设置轴的最大值。
- Minimum:获取或设置轴的最小值。
- Grid 类:提供用于管理 Axis 对象的主要和次要网格的方法和属性。
- Interval:获取或设置主要网格线或次要网格线之间的间隔。(相邻两个网格线间的间隔,int)
- IntervalType:获取或设置主要网格线或次要网格线的间隔类型。(计算单位)
- IntervalOffset:获取或设置网格线的偏移量。(第一个网格线偏移坐标轴的间隔,int)
- IntervalOffsetType:获取或设置主要网格线和次要网格线的间隔偏移量类型。(计算单位)
- LineColor:获取或设置网格线颜色。
- LineDashStyle:获取或设置网格的线型。
- LineWidth:获取或设置主要网格线和次要网格线的线条宽度。
- ChartAreaCollection 类:表示 ChartArea 对象的集合。
- Series:获取 SeriesCollection 对象。
- SeriesCollection 类:表示 Series 对象的集合。
- Count:获取 Collection
中实际包含的元素数。 - Item[Int32]:获取或设置指定索引处的元素。
- Item[String]:获取或设置具有指定名称的图表元素。
- Count:获取 Collection
- Series 类:存储数据点和序列特性。
- ChartType:获取或设置序列的图表类型。
- SeriesChartType 枚举:指定 Series 的图表类型。
- Area:面积图类型。
- Line:折线图类型。
- Spline:样条图类型。(光滑曲线)
- Column:柱形图类型。
- Pie:饼图类型。
- Doughnut:圆环图类型。
- SeriesChartType 枚举:指定 Series 的图表类型。
- XValueType:获取或设置沿 X 轴绘制的值类型。
- YValueType:获取或设置序列所存储的数据点中的 Y 值数据类型。
- ChartValueType 枚举:指定各种图表属性的值类型。
- Auto:属性类型由图表控件自动设置。
- Int32:Int32 值。
- DateTime:一个 DateTime 值。
- Time:[DateTime] 值的时间部分。
- ChartValueType 枚举:指定各种图表属性的值类型。
- IsValueShownAsLabel:获取或设置一个标志,该标志指示是否在标签上显示数据点的值。
- Points:获取 DataPointCollection 对象。(数据表中的数据点)
- DataPointCollection 类:表示 DataPoint 对象的集合。
- Count:获取 Collection
中实际包含的元素数。 - Item:获取或设置指定索引处的元素。(针对每一个 DataPoint 对象)
- AddXY(Double, Double):使用指定的 X 值和 Y 值将 DataPoint 对象添加到集合末尾。
1
2
3
4
5
6
7
8
///实现将时间数据赋值到 X 轴/////第一步:将 X 轴数值类型设置为 Timechart1.Series[0].XValueType = ChartValueType.Time;//第二步:将 DateTime 数据转为 double 类型DateTime dt = DateTime.Parse("2000/8/8 12:08:01");doubled = Double.Parse(dtzh.Rows[i]["Fo"].ToString());chart1.Series[0].Points.AddXY(dt.ToOADate(), d); - AddY(Double):使用指定的 Y 值将 DataPoint 对象添加到集合末尾。
- Clear:从 Collection
中移除所有元素。 - Insert:将元素插入 Collection
的指定索引处。 - InsertXY:插入具有指定 X 值和一个或多个指定 Y 值的数据点。
- InsertY:插入具有一个或多个指定 Y 值的数据点。
- Remove:从 Collection
中移除特定对象的第一个匹配项。 - RemoveAt:移除 Collection
的指定索引处的元素。
- Count:获取 Collection
- DataPoint 类:表示存储在 DataPointCollection 类中的数据点。
- XValue:获取或设置数据点的 X 值。
- YValues:获取或设置数据点的 Y 值。(数组的形式,值一般是[0])
- Color:获取或设置数据点的颜色。
- BorderColor:获取或设置数据点的边框颜色。
- DataPointCollection 类:表示 DataPoint 对象的集合。
- MarkerStyle:获取或设置标记样式。
- MarkerStyle 枚举:获取或设置标记样式。
- MarkerStyle 枚举:指定标记的样式。
- None:不为序列或数据点显示任何标记。
- Square:显示正方形标记。
- Circle:显示圆形标记。
- Diamond:显示菱形标记。
- Triangle:显示三角形标记。
- Cross:显示十字形标记。
- MarkerStyle 枚举:获取或设置标记样式。
- MarkerColor:获取或设置标记颜色。(数据点)
- MarkerSize:获取或设置标记的大小。
- MarkerBorderColor:获取或设置标记的边框颜色。
- MarkerBorderWidth:获取或设置标记的边框宽度。
- Color:获取或设置数据点的颜色。(数据点和连接的线)
- BorderWidth:获取或设置数据点的边框宽度。
- BorderDashStyle:获取或设置数据点的边框样式。
- BorderColor:获取或设置数据点的边框颜色。
- EmptyPointStyle:获取或设置标记为空的点的绘制样式。
- LabelBackColor:获取或设置数据点标签的背景色。
- LabelBorderColor:获取或设置数据点标签的边框颜色。
- LabelBorderDashStyle:获取或设置标签的边框样式。
- LabelBorderWidth:获取或设置标签的边框宽度。
- IsVisibleInLegend:获取或设置一个标志,该标志指示是否在图例中显示项。
- LegendText:获取或设置图例中项的文本。
- ChartType:获取或设置序列的图表类型。
- SeriesCollection 类:表示 Series 对象的集合。
- Titles:存储 Chart 控件使用的所有 Title 对象。
- TitleCollection 类:表示 Title 对象的集合。
- Count:获取 Collection
中实际包含的元素数。 - Item[Int32]:获取或设置指定索引处的元素。
- Add(T):将对象添加到 Collection
的结尾处。 - Add(String):将具有指定名称的 Title 对象添加到集合的末尾。
- Clear:从 Collection
中移除所有元素。 - ClearItems:从 Collection
中移除所有元素。
- Count:获取 Collection
- Title 类:表示整个图表图像的标题。
- Alignment:获取或设置标题的对齐方式。
- BackColor:获取或设置标题的背景色。
- Font:获取或设置标题的字体。
- ForeColor:获取或设置标题文本的颜色。
- ShadowColor:获取或设置标题的阴影颜色。
- ShadowOffset:获取或设置标题的阴影偏移量(以像素为单位)。
- Position:获取或设置可用于获取或设置标题位置的 ElementPosition 对象。
- Text:获取或设置标题的文本。
- TextOrientation:获取或设置标题中文本的方向。
- TextStyle:获取或设置标题的文本样式。
- TitleCollection 类:表示 Title 对象的集合。
- Legends:存储 Chart 控件使用的所有 Legend 对象。
- LegendCollection 类:表示 Legend 对象的集合。
- Count:获取 Collection
中实际包含的元素数。 - Item[Int32]:获取或设置指定索引处的元素。
- Item[String]:获取或设置具有指定名称的图表元素。
- Count:获取 Collection
- Legend 类:表示图表图像的图例。
- Alignment:获取或设置图例的对齐方式。
- StringAlignment 枚举:指定文本字符串相对于其布局矩形的对齐方式。
- Near:如果图例停靠到顶部或底部,则 Near 位于左侧;如果图例停靠到左侧或右侧,则 Near 位于顶部。
- Center:总是将图例垂直或水平居中。
- Far:如果图例停靠到顶部或底部,则 Far 位于右侧;如果图例停靠到左侧或右侧,则 Far 位于底部。
- StringAlignment 枚举:指定文本字符串相对于其布局矩形的对齐方式。
- Title:获取或设置图例标题的文本。
- ShadowColor:获取或设置图例的阴影颜色。
- ShadowOffset:获取或设置图例的阴影偏移量(以像素为单位)。
- Alignment:获取或设置图例的对齐方式。
- LegendCollection 类:表示 Legend 对象的集合。
