Python数据挖掘基础
目录
- 数据挖掘基础环境安装与使用
- 库的安装
- 学习目标
- jupyter notebook 的使用
- 介绍
- 优势
- 快速入手
- markdown演示
- Matplotlib
- 介绍
- 基础绘图
- matplotlib.pyplot模块
- 中文显示问题
- 常用语句
- Numpy
- 介绍
- 常用操作
数据挖掘基础环境安装与使用
库的安装
学习目标
搭建好数据挖掘基础阶段环境,包括Matplotlib,Numpy,Pandas,Ta-Lib(技术指标库),tables(hdfs),jupyter(数据分析与展示平台)等
jupyter notebook 的使用
介绍
- web的ipython;
- 名字:ju-Julia , py-python , ter-R;Jupiter–木星,宙斯
- 可以用来编程、写文档、记笔记、展示
- 保存为.ipynb后缀格式
优势
- 画图优势
- 数据展示优势
快速入手
-
界面启动、创建文件
在终端输入jupyter notebook/ipython
notebook -
cell操作
cell:一对in out会话被视作为一个代码单元,称为cell
编辑模式:enter进入/鼠标点击
命令模式:esc进入/鼠标在本单元格外点一下 -
快捷键:
两种模式通用:
shift + enter:执行本单元代码,并跳至下一单元
CTRL+enter:执行本单元代码,留在本单元
cell行号前的*,表示代码正在运行命令模式:
快捷键 功能 Y 切换到code模式 M 切换到markdown模式 A 在当前cell上面添加cell B 在当前cell下面添加cell 双击D 删除当前cell Z 回退 L 为当前cell加上行号 CTRL+shift+p 对话框输入命令直接运行 CTRL+home 快速跳转首个cell CTRL+end 快速跳转最后一个cell 编辑模式:
快捷键 功能 CTRL+鼠标点击 多光标操作 CTRL+Z 回退 CTRL+Z 重做 变量、方法后+tab 补全代码 CTRL+/ 添加/取消注释 在最后语句加分号 屏蔽自动输出信息
markdown演示
- 快捷键
| 快捷键 | 功能 |
|---|---|
| 撤销 | Ctrl/Command + Z |
| 重做 | Ctrl/Command + Y |
| 加粗 | Ctrl/Command + B |
| 斜体 | Ctrl/Command + I |
| 标题 | Ctrl/Command + Shift + H |
| 无序列表 | Ctrl/Command + Shift + U |
| 有序列表 | Ctrl/Command + Shift + O |
| 检查列表 | Ctrl/Command + Shift + C |
| 插入链接 | Ctrl/Command + Shift + L |
| 插入图片 | Ctrl/Command + Shift + G |
| 查找 | Command + F |
| 替换 | Command + G |
- 基础语法参考:
目录:@[TOC]
1级标题:# 1级标题
2级标题:## 2级标题
3级标题:### 3级标题
4级标题:#### 4级标题
5级标题:##### 5级标题
6级标题:###### 6级标题
强调文本:* * ;_ _
加粗文本:** **;__ __
标记文本:== ==
删除文本:~~ ~~
引用文本:>
下标:~
上标:^
Matplotlib
介绍
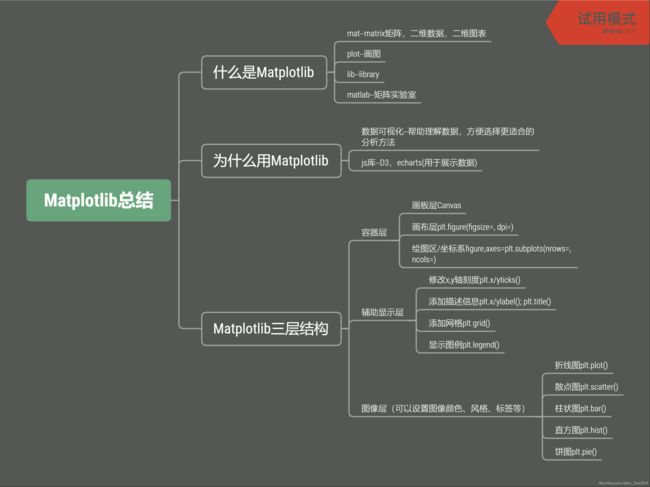
- 什么是matplotlib
mat-matrix 矩阵,二维数据,二维图表
plot-画图
lib-library
matlab-矩阵实验室,mat-matrix,lab-实验室 - 为什么用该库
数据可视化–帮助理解数据,方便选择更适合的分析方法
js库–D3, echarts(用来给他人展示) - 该库构成

a. 容器层
画板层(Canvas):位于最底层,用户一般接触不到
画布层(Figure):建立在画板层之上
绘图区(Axes):建立在画布层之上,包括坐标系、图例等辅助显示层、图像层
b. 辅助显示层
c. 图像层
基础绘图
matplotlib.pyplot模块
类似matlab的画图函数,作用于当前图形的当前坐标系
import matplotlib.pyplot as plt中文显示问题
- 永久一劳永逸设置
- 安装字体;
到中华字体网http://www.font5.com.cn/或本地windows/fonts找到simhei.ttf文件,复制粘贴到…Python36/Lib/site-packages/matplotlib/mpl-data/fonts/ttf(省略号指具体本地地址)下。 - 删除matplotlib缓存文件;
找到本地/用户/.matplotlib下的缓存文件删除
 - 配置文件
在…Python36/Lib/site-packages/matplotlib/mpl-data找到配置文件matplotlibrc;
修改信息如下:
font.family : sans-serif
font.sans-serif : SimHei, Bitstream Vera Sans, sans-serif …
即将SimHei添加到字库族
axes.unicode_minus,将True改为False,解决负号’-'显示问题
- 安装字体;
- 全局设置
# 设置matplotlib正常显示中文和负号
matplotlib.rcParams['font.sans-serif']=['SimHei']  # 用黑体显示中文
matplotlib.rcParams['axes.unicode_minus']=False    # 正常显示负号
- 局部设置
plt.xlabel("横轴/单位",fontproperties="STLiti")
plt.ylabel("纵轴/单位",fontproperties="STXingkai")
plt.title("标题",fontproperties="STXinwei")
常用语句
import matplotlib.pyplot as plt
import numpy as np
import pandas as pd
import seaborn as sns

# plot:面向过程的画图方法
plt.figure(figsize=(20,8),dpi=80) #创建画布;figsize指定图像长宽, dpi图像清晰度
plt.plot([1,2,3],[4,5,6],color = "r",linestyle = "--") #绘制图像;[]内分别为x,y轴;color线条颜色;linestyle线条格式
plt.title('Age distribution') #标题
plt.xlabel('Age') #x轴标签
plt.ylabel('#Employee') #y轴标签
plt.show() #显示图像;注意:show会释放figure资源,show之后保存的是空图片
plt.savefig(path) #保存图像
plt.xticks(x,**kwargs) #自定义修改x刻度
plt.yticks(y,**kwargs) #自定义修改y刻度
plt.grid(True,linestyle = "--",alpha = 0.5) #显示网格; linestyle网格形式;alpha透明度

# subplots:面向对象的画图方法
figure,axes = plt.subplots(nrows=1,ncols=2,**fig_kw) #创建一行两列多个绘图区
axes[0].plot() #面向对象的画法需要在plot前面加上指定绘图区
axes[0].legend() #显示图例
axes[0].set_xticks(x[::5],x_label[::5]) #修改x刻度
axes[0].set_yticks(range(0,40,5)) #修改y刻度
axes[0].grid(True,linestyle = "--",alpha = 0.5) #显示网格
axes[0].set_xlabel("时间") #x轴标签
axes[0].set_ylabel("温度") #y轴标签
axes[0].set_title("上海城市气温变化") #标题

# 直方图Histogram:
fig = plt.figure() #创建画布
ax = fig.add_subplot(1, 1, 1)
ax.hist(df['Age'], bins=7) #绘制图像,bin为组数
plt.title('Age distribution')
plt.xlabel('Age')
plt.ylabel('#Employee')
plt.show()

#箱线图
fig = plt.figure()
ax = fig.add_subplot(1, 1, 1)
ax.boxplot(df['Age'])
plt.show()

#小提琴图
sns.violinplot(df['Age'],df['Gender'])
sns.despine()

#条形图
var = df.groupby('Gender').Sales.sum()
fig = plt.figure()
ax1 = fig.add_subplot(1, 1, 1)
ax1.set_xlabel('Gender')
ax1.set_ylabel('Sum of Sales')
ax1.set_title('Gender wise Sum of Sales')
var.plot(kind='bar')

#折线图:趋势变化
var = df.groupby('BMI').Sales.sum()
fig = plt.figure()
ax1 = fig.add_subplot(1,1,1)
ax1.set_xlabel('BMI')
ax1.set_ylabel('Sum of Sales')
ax1.set_title('BMI wise Sum of Sales')
var.plot(kind = 'line') # 选择折线图类型

#二维堆叠柱形图:统计/对比
var = df.groupby(['BMI','Gender']).Sales.sum()
var.unstack().plot(kind = 'bar',stacked = True, color=['red','blue'],grid=False)

#散点图:反映关系/规律
plt.scatter(x,y) # 直接输入x,y轴即可

#气泡图
fig = plt.figure()
ax = fig.add_subplot(1,1,1)
ax.scatter(df['Age'],df['Sales'],s=df['Income']) #图像绘制
plt.show()

#饼图
var = df.groupby(['Gender']).sum().stack()
temp = var.unstack()
type(temp)
x_list = temp['Sales']
label_list = temp.index
plt.axis('equal')
plt.pie(x_list,labels = label_list,autopct = '%1.1f%%') #图像绘制
plt.title('Pastafarianism expenses')
plt.show()

#区域图
data = np.random.rand(4, 2) #生成数据
rows = list('1234')
columns = list('MF')
fig, ax = plt.subplots()
ax.pcolor(data, cmap=plt.cm.Reds, edgecolors='k')
ax.set_xticks(np.arange(0, 2) + 0.5)
ax.set_yticks(np.arange(0, 4) + 0.5)
ax.xaxis.tick_bottom()
ax.yaxis.tick_left()
ax.set_xticklabels(columns, minor=False, fontsize=20)
ax.set_yticklabels(rows, minor=False, fontsize=20)
plt.show()
Numpy
介绍
- 什么是Numpy?
高效的运算工具,数值计算库,支持常见的数组和矩阵操作。numpy使用ndarry对象来处理多维数组。 - ndarry介绍
- 存储风格:
ndarry = numpy array,数据和数据的地址是连续的,相同类型,通用性不强
list – 不同类型,通用性很强 - 并行化运算
ndarry 支持向量化运算 - 底层语言
C语言,解除了GIL
- 存储风格:
- 注意点
- 广播机制
操作两个数组时,numpy会比较它们的shape,只要形状相同才会计算;
广播机制为了方便不同形状的数组进行数学运算,前提是维度相等,shape其中相对应的地方为1;
- 广播机制
常用操作
import numpy as np
#查看属性
ndarry.shape #获取行列数
ndarry.dtype #类型
ndarry.ndim #数组维数
ndarry.size #数组中的元素数量
ndarry.itemsize #一个数据元素的长度(字节)
#生成数组
np.zeros(shape) #生成0的数组
np.ones(shape) #生成1的数组
np.array() #从现有数组中生成,深拷贝生成后不随原数组改变
np.copy() #深拷贝生成后不随原数组改变
np.asarray() #浅拷贝,生成后随原数组改变
np.linspace(start,end,num,endpoint,retstep,dtype) #生成start-end固定范围的数组,等距离生成,endpoint指是否包含stop值
np.arange(start,stop,step,dtype)  #以step为距离生成
np.random.uniform(low=a,high=b,size=n) #生成采样下界为a,上界为b,样本数为n的随机均匀分布数组
np.random.normal(loc=a,scale=b,size=n) #生成均值为a,标准差为b,样本数为n的数组
my_array[0,:3] #数组切片取值
my_array[1,2,3] #数组索引取值
my_array.reshape([10,8]) #形状修改,行列互换,返回新的数组,原始数据不变
my_array.resize(shape) #没有返回值,对原始数组进行修改
my_array.T #转置
my_array.astype() #数组类型修改
np.unique() #去重
np.append(other_array) #增加记录
np.insert(my_array,1,5) #插入记录
np.delete(my_array,[1]) #删除记录
#逻辑运算
np.all() #只要有一个false则返回false,全true返回true
np.any() #全false返回false
np.where(blossoms,true返回值,false返回值) #三元运算符
np.logical_or() #逻辑或
np.logical_and() #逻辑与
#统计运算
np.max(my_array,axis=0/1) #最大值,axis=0按列,axis=1按行
np.min() #最小值
np.mean(my_array) #获取平均值
np.median(my_array) #获取中位数
np.corrcoef() #获取方差
np.std(my_array) #获取标准差
np.argmax(my_array,axis=0/1) #返回最大值的索引位置
#其他
np.hsatck() #横向拼接
np.vstack() #纵向拼接
np.concatenate() #横向拼接
np.genformtxt('test.csv',delimiter=',') #读取文件
