Particle Filter算法
本次基于Paricles Filter的开源python代码,用几种方法对最终的mouse位置进行计算
源代码详情见:
代码及说明链接:
http://ros-developer.com/2019/04/10/parcticle-filter-explained-with-python-code-from-scratch/
里面包含上述问题的原理讲解视频及相应源代码(鼠标坐标即robot)。
import numpy as np
import scipy
from numpy.random import uniform
import scipy.stats
import heapq
np.set_printoptions(threshold=3)
np.set_printoptions(suppress=True)#压缩显示数据
import cv2
from sklearn.cluster import MeanShift, estimate_bandwidth
#pip install sklearn -i https://pypi.tuna.tsinghua.edu.cn/simple
import random
def drawLines(img, points, r, g, b):
    cv2.polylines(img, [np.int32(points)], isClosed=False, color=(r, g, b))


def drawCross(img, center, r, g, b):
    d = 5
    t = 2
    if cv2.__version__[0]=='4':
        LINE_AA = cv2.LINE_AA
    else:
        LINE_AA=cv2.CV_AA
    # LINE_AA = cv2.LINE_AA if cv2.__version__ == '3' else cv2.CV_AA
    #这里需要修改一下'3',根据cv版本的不同,里面的宏定义不同
    color = (r, g, b)
    ctrx = center[0, 0]
    ctry = center[0, 1]
    cv2.line(img, (ctrx - d, ctry - d), (ctrx + d, ctry + d), color, t, LINE_AA)
    cv2.line(img, (ctrx + d, ctry - d), (ctrx - d, ctry + d), color, t, LINE_AA)


def mouseCallback(event, x, y, flags, null):#代表鼠标位于窗口的(x,y)坐标位置,即Point(x,y);
    global center
    global trajectory
    global previous_x
    global previous_y
    global zs

    center = np.array([[x, y]])
    #print(center, end='\n')
    trajectory = np.vstack((trajectory, np.array([x, y]))) #将两个数组按行放到一起
    #print(trajectory,end='\n')
    # gauss_noise=sensorSigma * np.random.randn(1,2) + sensorMu
    # gauss_noise = np.array([0.] * NL)
    # for i in range(0, NL):
    #     gauss_noise[i] += (random.gauss(gauss_mu, gauss_sigm) * 5)
    if previous_x > 0:
        heading = np.arctan2(np.array([y - previous_y]), np.array([previous_x - x]))

        if heading > 0:
            heading = -(heading - np.pi)
        else:
            heading = -(np.pi + heading)
        # print(heading)
        # 求范数,默认ord=2为求二范数,也就是距离,axis=1表示按行向量处理,求多个行向量的范数
        distance = np.linalg.norm(np.array([[previous_x, previous_y]]) - np.array([[x, y]]), axis=1)
        # print(distance,end='\n')两次移动之间的距离
        std = np.array([2, 4])
        u = np.array([heading, distance])
        # 原始粒子得到预测粒子
        predict(particles, u, std, dt=1.)
        # 计算鼠标与landmark之间的距离z[i]
        # zs = np.linalg.norm(landmarks - center, axis=1)
        # zs = (np.linalg.norm(landmarks - center, axis=1) + (np.random.randn(NL) * sensor_std_err))
        # #更新权重
        # zs += gauss_noise
        number_measurement=10
        zs = np.array([0.]*NL)
        for times in range(0,number_measurement):
            gauss_noise = np.array([0.] * NL)
            for i in range(0, NL):
                gauss_noise[i] += (random.gauss(gauss_mu, gauss_sigm) * 5)
            zs += (np.linalg.norm(landmarks - center, axis=1) + (np.random.randn(NL) * sensor_std_err))+gauss_noise
        zs /=number_measurement
        update(particles, weights, z=zs, R=50, landmarks=landmarks)
        # print(weights,end='\n')
        indexes = systematic_resample(weights)
        # print(indexes,end='\n')
        resample_from_index(particles, weights, indexes)
        # max=max_weight(weights)

    previous_x = x
    previous_y = y


WIDTH = 800
HEIGHT = 600
WINDOW_NAME = "Particle Filter"
#高斯白噪声的均值
gauss_mu=0
gauss_sigm=5
sensorMu=0
sensorSigma=3

sensor_std_err = 5


def create_uniform_particles(x_range, y_range, N):
    particles = np.empty((N, 2))
    particles[:, 0] = uniform(x_range[0], x_range[1], size=N)
    particles[:, 1] = uniform(y_range[0], y_range[1], size=N)
    return particles


def predict(particles, u, std, dt=1.):
    N = len(particles)
    #randn函数返回一个或一组样本,具有标准正态分布
    dist = (u[1] * dt) + (np.random.randn(N) * std[1])
    particles[:, 0] += np.cos(u[0]) * dist
    particles[:, 1] += np.sin(u[0]) * dist


def update(particles, weights, z, R, landmarks):
    weights.fill(1.)
    for i, landmark in enumerate(landmarks):
        # 计算每个particle与landmark之间的距离
        distance = np.power((particles[:, 0] - landmark[0]) ** 2 + (particles[:, 1] - landmark[1]) ** 2, 0.5)
        weights *= scipy.stats.norm(distance, R).pdf(z[i])
        # weights *= scipy.stats.pareto(distance, R).pdf(z[i])
    weights += 1.e-300  # avoid round-off to zero
    weights /= sum(weights)


def neff(weights):
    return 1. / np.sum(np.square(weights))


def systematic_resample(weights):
    N = len(weights)
    positions = (np.arange(N) + np.random.random()) / N
    # 步长为1,从0开始
    #print(positions,end='\n')
    indexes = np.zeros(N, 'i')
    cumulative_sum = np.cumsum(weights)
    # cunsum给出的是累计和
    #print(cumulative_sum,end='\n')
    i, j = 0, 0
    while i < N and j < N:
        if positions[i] < cumulative_sum[j]:
            indexes[i] = j
            i += 1
        else:
            j += 1
    return indexes


def estimate(particles, weights):
    pos = particles[:, 0:1]
    mean = np.average(pos, weights=weights, axis=0)
    # 权重平均
    var = np.average((pos - mean) ** 2, weights=weights, axis=0)
    return mean, var

def estimate_1(particles,center_pos):
    pos = particles[:, 0:1]
    var = np.average((pos - center_pos) ** 2, weights=weights, axis=0)
    return var

def weights_pos(particles, weights):
    pos_1 = particles[:, 0:1]
    mean_1 = np.average(pos_1, weights=weights, axis=0)
    pos_2 = particles[:, 1:]
    mean_2 = np.average(pos_2, weights=weights, axis=0)
    return mean_1,mean_2

def resample_from_index(particles, weights, indexes):
    particles[:] = particles[indexes]
    weights[:] = weights[indexes]
    weights /= np.sum(weights)

# 获取weights最大值的下标
def max_weight(weights):
    return np.argmax(weights)

#获取权重前N个最大的particles的平均值
def n_max_weight_average(particles,weights,n):
    average = np.array([0.,0.])
    temp_list_w=weights.tolist()
    max_n_list=list(map(temp_list_w.index,heapq.nlargest(n,temp_list_w)))
    for i in max_n_list:
        average += particles[i]
    return average/n

# 利用meanshift聚类算法找出粒子的中心点
def mean_shift(particles):
    bandwidth1 = estimate_bandwidth(particles, quantile=0.5)
    ms = MeanShift(bandwidth=bandwidth1, bin_seeding=True)
    ms.fit(particles)
    labels = ms.labels_
    cluster_centers = ms.cluster_centers_
    return cluster_centers

x_range = np.array([0, 800])
y_range = np.array([0, 600])

# Number of partciles
N = 400
#landmarks的位置坐标
landmarks = np.array([[144, 73], [410, 13], [336, 175], [718, 159], [178, 484], [665, 464]])
NL = len(landmarks)
#初始化粒子的坐标,初始为均匀分布
particles = create_uniform_particles(x_range, y_range, N)

weights = np.array([1.0] * N)

# Create a black image, a window and bind the function to window
img = np.zeros((HEIGHT, WIDTH, 3), np.uint8)
cv2.namedWindow(WINDOW_NAME)
cv2.setMouseCallback(WINDOW_NAME, mouseCallback)

center = np.array([[-10, -10]])

trajectory = np.zeros(shape=(0, 2))
robot_pos = np.zeros(shape=(0, 2))
previous_x = -1
previous_y = -1
DELAY_MSEC = 50

while (1):

    cv2.imshow(WINDOW_NAME, img)
    img = np.zeros((HEIGHT, WIDTH, 3), np.uint8)
    drawLines(img, trajectory, 0, 255, 0)
    drawCross(img, center, r=255, g=0, b=0)

    # landmarks
    for landmark in landmarks:
        cv2.circle(img, tuple(landmark), 10, (255, 0, 0), -1)

    # draw_particles:
    for particle in particles:
        cv2.circle(img, tuple((int(particle[0]), int(particle[1]))), 1, (255, 255, 255), -1)

    if cv2.waitKey(DELAY_MSEC) & 0xFF == 27:
        break

    cv2.circle(img, (10, 10), 10, (255, 0, 0), -1)
    cv2.circle(img, (10, 30), 3, (255, 255, 255), -1)
    cv2.putText(img, "Landmarks", (30, 20), 1, 1.0, (255, 0, 0))
    cv2.putText(img, "Particles", (30, 40), 1, 1.0, (255, 255, 255))
    cv2.putText(img, "Robot Trajectory(Ground truth)", (30, 60), 1, 1.0, (0, 255, 0))
    # 实际的鼠标位置x,y
    mouse_loc="("+str(center[0][0])+","+str(center[0][1])+")"
    cv2.putText(img, "mouse(x,y):"+mouse_loc, (30, 200), 1, 1.0, (0, 0, 255))
    #print(particles[max_weight(weights)],end='\n')
    # 取权重最大的粒子作为鼠标的位置
    location_max="("+str(round(particles[max_weight(weights)][0],2))+","+str(round(particles[max_weight(weights)][1],2))+")"
    cv2.putText(img, "Max_weight(x,y):"+location_max, (30, 230), 1, 1.0, (255, 255, 0))
    # 取前N个最大权重的粒子的平均作为鼠标的位置
    location_n_max_average=n_max_weight_average(particles,weights,50)
    location_n_max_average_text="("+str(round(location_n_max_average[0],2))+","+str(round(location_n_max_average[1],2))+")"
    cv2.putText(img, "Max_n_weight(x,y):" + location_n_max_average_text, (30, 250), 1, 1.0, (255, 0, 255))
    # 聚类算法算出来的中心点
    center_mean=mean_shift(particles)
    # print(center_mean,end='\n')
    center_mean_text="("+str(round(center_mean[0][0],2))+","+str(round(center_mean[0][1],2))+")"
    cv2.putText(img, "meanshift(x,y):" + center_mean_text, (30, 270), 1, 1.0, (0, 255, 255))
    #权重平均坐标
    weights_x,weights_y=weights_pos(particles,weights)
    weights_x_text=str(round(weights_x[0],2))
    weights_y_text = str(round(weights_y[0],2))
    cv2.putText(img, "weights_average(x,y):" + "("+weights_x_text+","+weights_y_text+")", (30, 290), 1, 1.0, (255, 255, 255))
    drawLines(img, np.array([[10, 55], [25, 55]]), 0, 255, 0)

cv2.destroyAllWindows()
一、计算root的位置
1.选取权重的最大的particle的位置作为root的位置
# 获取weights最大值的下标
def max_weight(weights):
    return np.argmax(weights)
2.选区前N个权重最大的particle的位置平均作为root的位置
#获取权重前N个最大的particles的平均值
def n_max_weight_average(particles,weights,n):
    average = np.array([0.,0.])
    temp_list_w=weights.tolist()
    max_n_list=list(map(temp_list_w.index,heapq.nlargest(n,temp_list_w)))
    for i in max_n_list:
        average += particles[i]
    return average/n
3.利用均值漂移算法meanshift确定root的位置
# 利用meanshift聚类算法找出粒子的中心点
def mean_shift(particles):
    bandwidth1 = estimate_bandwidth(particles, quantile=0.5)
    ms = MeanShift(bandwidth=bandwidth1, bin_seeding=True)
    ms.fit(particles)
    labels = ms.labels_
    cluster_centers = ms.cluster_centers_
    return cluster_centers
4.权值平均
def weights_pos(particles, weights):
    pos_1 = particles[:, 0:1]
    mean_1 = np.average(pos_1, weights=weights, axis=0)
    pos_2 = particles[:, 1:]
    mean_2 = np.average(pos_2, weights=weights, axis=0)
    return mean_1,mean_2

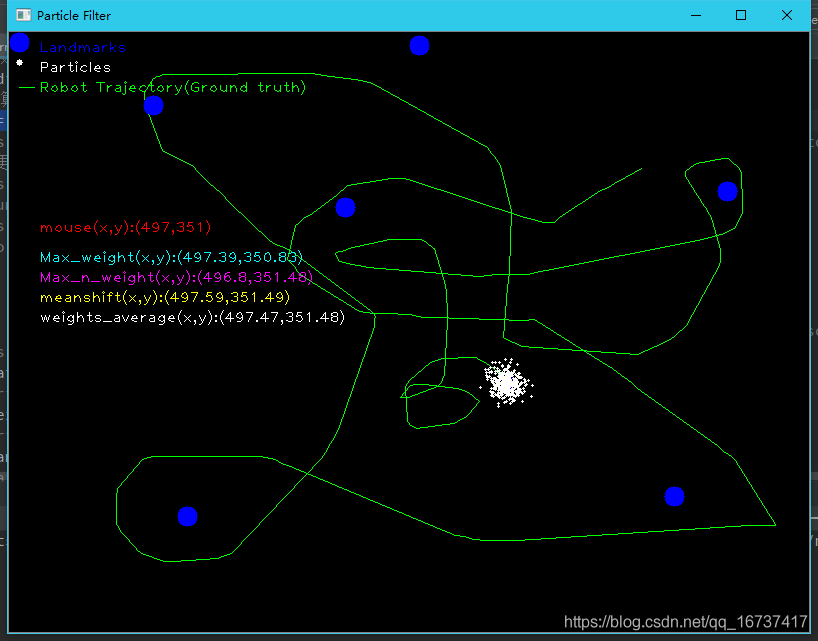
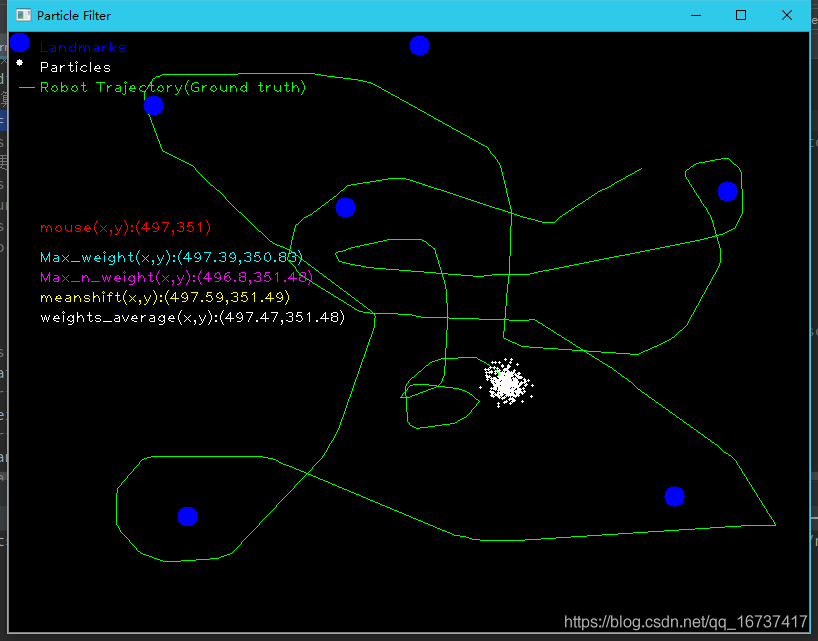
红色mouse(x,y)为鼠标的的实际位置
由于,粒子的预测是由鼠标的运动来决定的,因此鼠标运动的方向不同,得到的粒子云分布也不同,三种方法的准确度各有不同.计算出来的坐标具有很高的精确度
a.当直接计算root与landmark之间的距离是,无传感器错误,也无其他噪声
zs = np.linalg.norm(landmarks - center, axis=1)
未添加任何噪声

这个时候,四种计算方法计算出来的Particle位置与实际鼠标位置较为符合
b.添加传感器干扰与随机噪声
zs = (np.linalg.norm(landmarks - center, axis=1) + (np.random.randn(NL) * sensor_std_err))+guass_noise

随着添加sensor干扰,与高斯白噪声之后,meanshift和权重平均给出的结果较其他两者拥有很高的精确度。一部分原因由于计算robot位置的方式不同,在加入噪声之后,更新权值就会被影响,故根据权值计算robot位置就受到了影响。而meanshift是根据Particle的分布进行聚类,逐渐向分布particle最密集的地方移动,因此受影响较小,拥有较高的精确度。
二、修改weights的分布为帕累托分布(当前使用的是正态分布)
def update(particles, weights, z, R, landmarks):
    weights.fill(1.)
    for i, landmark in enumerate(landmarks):
        # 计算每个particle与landmark之间的距离
        distance = np.power((particles[:, 0] - landmark[0]) ** 2 + (particles[:, 1] - landmark[1]) ** 2, 0.5)
        # weights *= scipy.stats.norm(distance, R).pdf(z[i])
        weights *= scipy.stats.pareto(distance, R).pdf(z[i])
        # 此处修改为帕累托分布
    weights += 1.e-300  # avoid round-off to zero
    weights /= sum(weights)

图片来源于网络,侵删
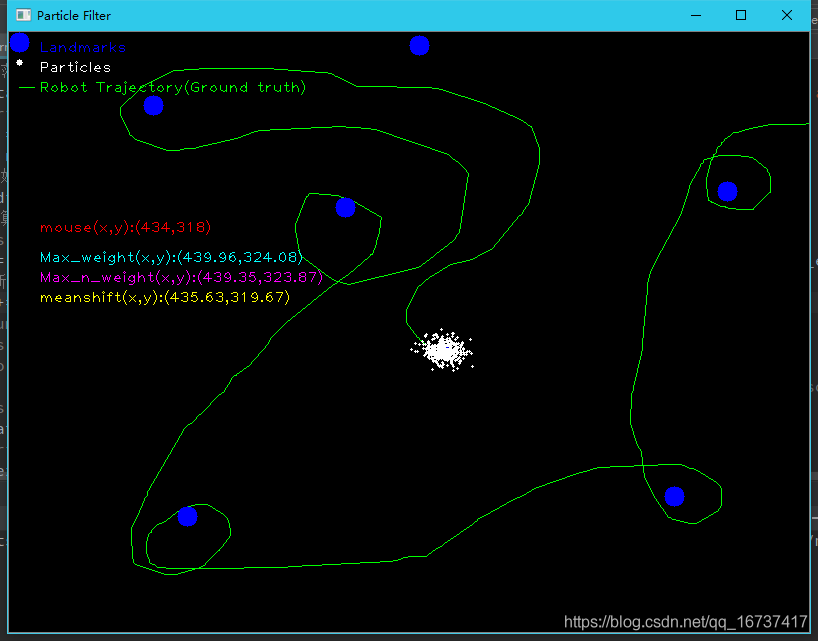
根据meanshift容易受小向量的影响,故在修改为Pareto分布后,得出的位置与实际root的位置相差很大
三、为landmark和robot之间的距离增加随机误差,观察定位结果
#高斯白噪声的均值
gauss_mu=0
gauss_sigm=3
guass_noise=np.array([0.]*NL)
for i in range(0,NL):
	gauss_noise[i] += random.gauss(gauss_mu,gauss_sigm)
zs = (np.linalg.norm(landmarks - center, axis=1) + (np.random.randn(NL) * sensor_std_err))+gauss_noise

随着加入的噪声,前两种计算方法所计算出的来的robot位置逐渐与真实位置mouse相偏离,噪声越大,与真实位置相差更远
后面两种计算robot位置的方法,发生一定的误差,但在鼠标移动一定的条件下,仍可以得出较为精确的结果
四、对随机噪声的压制
这样考虑,通过多次采样计算robot与landmark之间的距离,进行加和平均,这样使得正负的随机噪声可以相互的抵消,对计算robot的位置有积极的促进作用。
number_measurement=40
        zs = np.array([0.]*NL)
        for times in range(0,number_measurement):
            gauss_noise = np.array([0.] * NL)
            for i in range(0, NL):
                gauss_noise[i] += (random.gauss(gauss_mu, gauss_sigm) * 5)
            zs += (np.linalg.norm(landmarks - center, axis=1) +gauss_noise)
        zs /=number_measurement
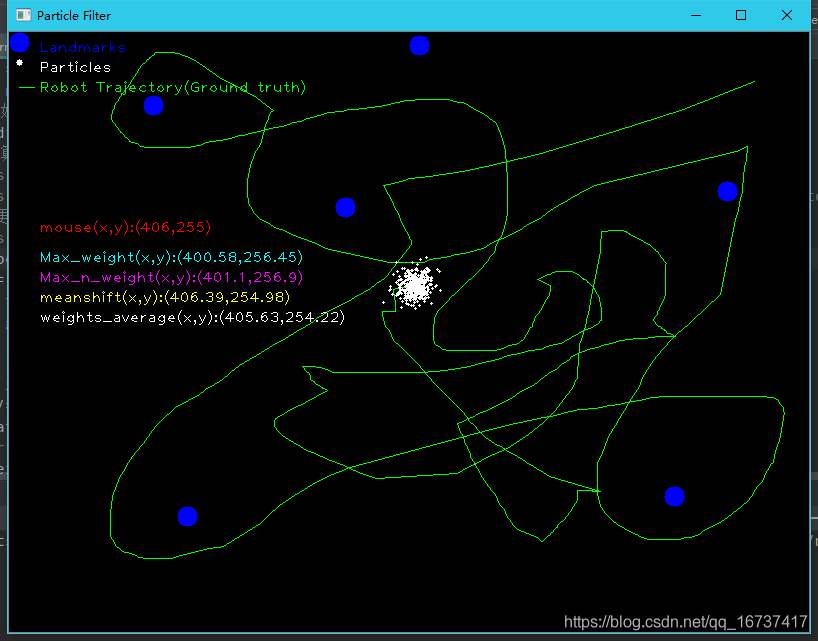
在相同的噪声情况下,下面呈现有无进行多次采样的定位对比
1.没有进行rotbot与landmark之间的距离的多次采样

2.对rotbot与landmark之间的距离进行40的重复采集

鼠标的运动不同,得到的结果也有一定的差异,因此控制变量的对比有一定的困难。
但是运行程序从总体来看,整体提高了对robot的精确度,对压制随机噪声有一定的作用。