Faster-RCNN 源码解析
参考文档:读懂Faster RCNN - 白裳的文章 - 知乎 https://zhuanlan.zhihu.com/p/31426458
一 :目标检测发展概述
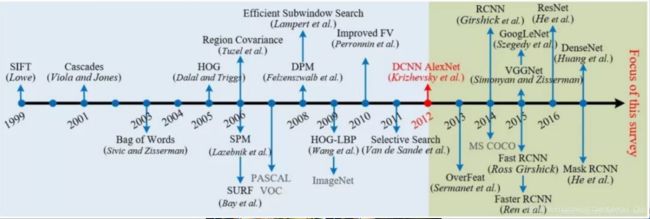
如上图所示,目标检测在2012年之前还是使用传统的方法。之后深度学习在计算机视觉的应用,使得各种框架涌现出来,这里我们挑选最经典的进行解析,领悟其中的思想。
在之前的经验基础上,2016年提出faster-rcnn,将特征抽取,候选框选定,框位置的确定,分类都整合在一个网络中。使得综合性能有较大的提高。网络结构如下:
大体上包含四个部分:
1 Conv layer ,包含卷积,池化,激活三种层,值得注意的是这一部分的卷积不会改变输入矩阵的大小,只有pool会,经过四个pooling ,原图像变成(M/16 * N/16),这样固定尺寸以便特征图和原图对应起来。
2 RPN 抛弃了传统的滑动窗口和SS方法,使用RPN快速生成检测框和预测框的坐标系数,架构如下图所示:
3 特征图和预测框通过ROI pooling 获取固定尺寸的预测目标特征图,即利用预测框,从特征图把目标抠出来
4 分类和坐标回归
从代码的角度解释训练步骤:
step 1: 初始化所有anchor,并找出有效的anchor和对应的index,anchor的个数是特征图的WxH个
def init_anchor(img_size=800, sub_sample=16):
    ratios = [0.5, 1, 2]
    anchor_scales = [8, 16, 32]  # 该尺寸是针对特征图的

    # 一个特征点对应原图片中的16*16个像素点区域, 'img_size // sub_sample'得到特征图的尺寸
    feature_size = (img_size // sub_sample)
    # 这里相当于把图像分割成feature_size*feature_size的网格, 每个网格对应一个特征点。
    # ctr_x, ctr_y: 每个网格的右下方坐标
    ctr_x = np.arange(sub_sample, (feature_size + 1) * sub_sample, sub_sample)  # 共feature_size个
    ctr_y = np.arange(sub_sample, (feature_size + 1) * sub_sample, sub_sample)  # 共feature_size个
    # print len(ctr_x)  # 50

    index = 0
    # ctr: 每个网格的中心点,一共feature_size*feature_size个网格
    ctr = dict()
    for x in range(len(ctr_x)):
        for y in range(len(ctr_y)):
            ctr[index] = [-1, -1]
            ctr[index][1] = ctr_x[x] - 8  # 右下角坐标 - 8 = 中心坐标
            ctr[index][0] = ctr_y[y] - 8
            index += 1
    # print len(ctr)  # 将原图片分割成50*50=2500(feature_size*feature_size)个区域的中心点

    # 初始化:每个区域有9个anchors候选框,每个候选框的坐标(y1, x1, y2, x2)
    anchors = np.zeros(((feature_size * feature_size * 9), 4))  # (22500, 4)
    index = 0
    # 将候选框的坐标赋值到anchors
    for c in ctr:
        ctr_y, ctr_x = ctr[c]
        for i in range(len(ratios)):
            for j in range(len(anchor_scales)):
                # anchor_scales 是针对特征图的,所以需要乘以下采样"sub_sample"
                h = sub_sample * anchor_scales[j] * np.sqrt(ratios[i])
                w = sub_sample * anchor_scales[j] * np.sqrt(1. / ratios[i])
                anchors[index, 0] = ctr_y - h / 2.
                anchors[index, 1] = ctr_x - w / 2.
                anchors[index, 2] = ctr_y + h / 2.
                anchors[index, 3] = ctr_x + w / 2.
                index += 1

    # 去除坐标出界的边框,保留图片内的框——图片内框
    valid_anchor_index = np.where(
        (anchors[:, 0] >= 0) &
        (anchors[:, 1] >= 0) &
        (anchors[:, 2] <= 800) &
        (anchors[:, 3] <= 800)
    )[0]  # 该函数返回数组中满足条件的index
    # print valid_anchor_index.shape  # (8940,),表明有8940个框满足条件

    # 获取有效anchor(即边框都在图片内的anchor)的坐标
    valid_anchor_boxes = anchors[valid_anchor_index]
    # print(valid_anchor_boxes.shape)  # (8940, 4)

    return anchors, valid_anchor_boxes, valid_anchor_index
假设上面 valid_anchor_boxes =[8940,4]。即有8940个有效框。
计算有效anchor与目标框(事先标记好的目标框)的IOU,得到与每个目标框的交并比,例如:输入一张图像,里面有个人和汽车两个目标,本次步骤就是计算与所有有效anchor 与每个目标的交并比 是一个【8940 ,2】的数组。然后根据交并比筛选出一定比例的正anchor和负anchor。
step 2:利用MAX IOU 为每个anchor 分配位置
def get_coefficient(anchor, bbox):
    # 根据上面得到的预测框和与之对应的目标框,计算4维参数(平移参数:dy, dx; 缩放参数:dh, dw)

    height = anchor[:, 2] - anchor[:, 0]
    width = anchor[:, 3] - anchor[:, 1]
    ctr_y = anchor[:, 0] + 0.5 * height  #为anchor的中心坐标
    ctr_x = anchor[:, 1] + 0.5 * width

    base_height = bbox[:, 2] - bbox[:, 0]
    base_width = bbox[:, 3] - bbox[:, 1]
    base_ctr_y = bbox[:, 0] + 0.5 * base_height
    base_ctr_x = bbox[:, 1] + 0.5 * base_width  #groud truth 的中心坐标

    eps = np.finfo(height.dtype).eps #返回非负数的最大值
    height = np.maximum(height, eps) #去两个数中较大的一个
    width = np.maximum(width, eps)

    dy = (base_ctr_y - ctr_y) / height
    dx = (base_ctr_x - ctr_x) / width
    dh = np.log(base_height / height)
    dw = np.log(base_width / width)
   # print("dxxxxxxxxxxxxxxxxxx")
   # print(len(dy))
   # print(len(dx))
   # print(dy[0],dx[0],dh[0],dw[0])
    gt_roi_locs = np.vstack((dy, dx, dh, dw)).transpose()
   #print(gt_roi_locs[0])
   #print(gt_roi_locs.shape)
    # print(gt_roi_locs.shape)

    return gt_roi_locs
在之前我们得到了8940个有效框和iou数组,根据有效框和那个目标框IOU最大,给anchor分配对用的目标框坐标(上面代码中bbox 参数)。然后根据这个代码得到每个anchor和目标框的偏移量 存放到anchor_loc中 ,然后根据这个数组为所有anchor赋值,无效系数为0 。然后为每个anchor设置label(positive or negative)存放到anchor_conf,所以这两个数组的大小都是22500.
step 3 RPN 预测出来的pre_anchor_loc 和pre_anchor_conf 和上面一步得到的损失
def roi_loss(self, pre_loc, pre_conf, target_loc, target_conf, weight=10.0):
        # 分类损失
        target_conf = torch.autograd.Variable(target_conf.long())
        pred_conf_loss = torch.nn.functional.cross_entropy(pre_conf, target_conf, ignore_index=-1)
        # print(pred_conf_loss)  # Variable containing:  3.0515

        #  对于 Regression 我们使用smooth L1 损失
        # 用计算RPN网络回归损失的方法计算回归损失
        # pre_loc_loss = REGLoss(pre_loc, target_loc)
        pos = target_conf.data > 0  # 标签中大于0的为1 ,小于0的为0
        print(pos[:10])
        print("pos")
       # print(pos.unsqueeze(1).shape)  #在第二个维度上增加一个维度
        mask = pos.unsqueeze(1).expand_as(pre_loc)  # 使维度和pre_loc 维度一样,不够的按第一个填充
        print(mask.shape) #[22500,4]

        # 现在取有正数标签的边界区域
        mask_pred_loc = pre_loc[mask].view(-1, 4)
        mask_target_loc = target_loc[mask].view(-1, 4) #存储的是离grouth box的偏移量
        print(mask_pred_loc.shape, mask_target_loc.shape)  # ((18L, 4L), (18L, 4L))

        x = np.abs(mask_target_loc.numpy() - mask_pred_loc.data.numpy())
        print("x.shape")
        print (x.shape)  # (18, 4)
        #smooth L1
        pre_loc_loss = ((x < 1) * 0.5 * x ** 2) + ((x >= 1) * (x - 0.5))
        # print(pre_loc_loss.sum())  # 1.4645805211187053

        N_reg = (target_conf > 0).float().sum() #18
        print(N_reg.data.numpy())
        N_reg = np.squeeze(N_reg.data.numpy())
        print(N_reg)  #18.0
        pre_loc_loss = pre_loc_loss.sum() / N_reg
        pre_loc_loss = np.float32(pre_loc_loss)
        # print pre_loc_loss  # 0.077294916
        # pre_loc_loss = torch.autograd.Variable(torch.from_numpy(pre_loc_loss))
        # 损失总和
        pred_conf_loss = np.squeeze(pred_conf_loss.data.numpy())
        total_loss = pred_conf_loss + (weight * pre_loc_loss)

        return total_loss
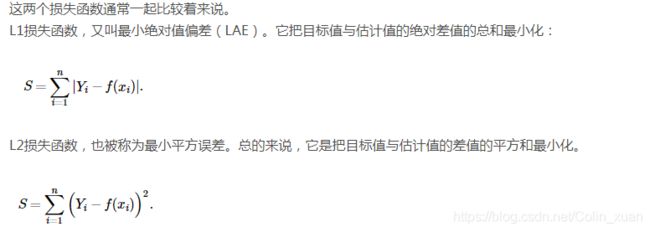
对于置信度我们是用softmax 交叉熵计算损失,使用soomth L1 loss损失函数,这里多说依据为什么这么选损失函数
对于L1。因为存在多个解,数据集有一个微小变化,解就有一个很大的波动。
对于L2。因为L2将误差平方化,如果数据集有异常点,模型需要较大幅度调整,这样会牺牲很多正常样本。
smooth L1 综合了以上两个的优点。使得模型更加稳定。
softmax 交叉熵损失函数。更加稳定,发展到后期,为了解决类别不平衡问题,何凯明提出了focal loss(背景是,二阶段的目标检测精度之所以比一阶段的高,原因是类别不平衡引起的,在faster rcnn 中第一阶段会对anchor 做一个简单的分类,所以后续不想yolo 有那么多的anchor是背景无效的,)
通过在交叉熵损失函数前面乘以系数,用过At来调节样本比例。
经过步骤三,我们得到了坐标系数损失和置信度损失。
step 4: 根据anchor预测的系数,将anchor通过平移转换为要预测的目标框(作用在全图上的),并根据每个预测框的所属类别得到预测框的类别,然后在根据预测的分值进行过滤。
解释如下:上一步骤我们通过RPN得到了预测框的坐标和置信度,然后我们根据置信度筛选出一部分,然后根据坐标系数得到对应当初22500个anchor的框,就是22500个anchor和坐标系数操作,得到预测框,和预测label,记为 roi_loc和roi_label
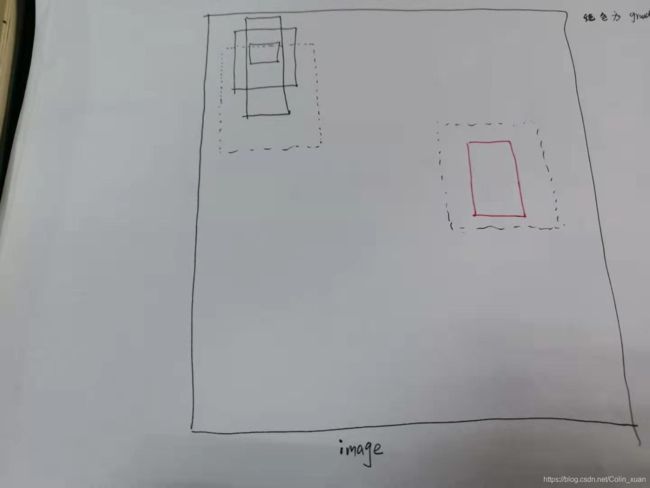
可以做如图理解:
红色框:事先标记好的groud_truth
黑色实心框:初始化的22500个anchor(有效的有8940个) ,预先知道和红色框的偏移系数和label
黑色虚线框: 根据RPN预测偏移坐标系数,修正黑色实心框的位置。
所以在有反向传播,loss的时候,会尽量让RPN预测的坐标系数更准(有标签),所以得到的预测框才更准。
其实训练过程就是不断修正anchor的位置,让它尽量接近目标框
上一步得到的预测框会有很多重叠,我们根据阈值和预测框的得分值(label)过滤出一定个数的预测框。然后分类回归,从上面步骤中得到了要预测框的信息(roi_loc),和分类回归之后得到的值,然后计算损失,反向传播。


