使用JMeter对接口进行压力测试
How to Test Web Service Performance With JMeter
Download & Install
Download and unzip. Run bin/jmeter.bat, will see the UI to new test plan.
https://jmeter.apache.org/
Test Plan
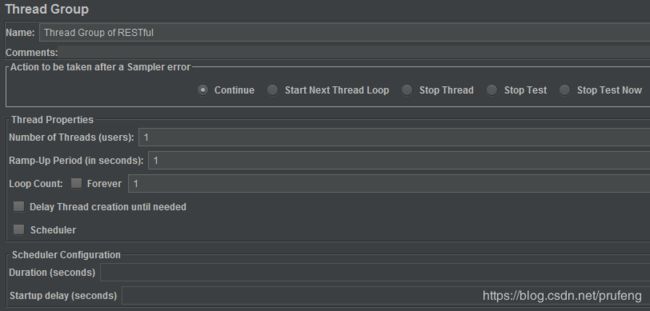
Thread Group
Action to be taken after a Sampler error
- Continue
- Start Next Thread Loop
- Stop Thread
- Stop Test
- Stop Test Now
Stop Test Now will stop the whole test immediately. Any current samplers are interrupted if possible.
Thread Properties
- Number of Threads (users)
- Ramp-Up Period (in seconds)
- Loop Count
- Scheduler
- Duration (seconds)
- Startup delay (seconds)
Ramp-Up Period means the time Jemter need to start the Number of Threads.
Loop Count is for each thread, that means if we have 5 threads, with loop count 2, the service will get 10 requests totally.
HTTP Request
Right click Thread Group -> Add -> Sampler -> HTTP Request.

Input protocol, IP, port, method, path, etc.
Insert data into Parameters or Body Data.
If body data is required for JSON or XML, add appropriate Content-Type in HTTP Header Manager.
HTTP Header Manager
Right click HTTP Request -> Add -> Config Element -> HTTP Header Manager.
- Test SOAP
Content-Type text/xml
- Test RESTful With JSON
Content-Type application/json
Kick Start
Right click the thread group name and click Start will run tests in this thread group.
Click Start button in the top of the screen will run all thread group tests.
Listener
When you just start the test and want to see the response, to double confirm if the request is feedback correctly, you can add Listener.
Right click the HTTP request -> Add -> Listener -> View Result Tree.
You can see many other Listeners also.
e.g.
- Summary Report
- Aggregate Report
- Graph Result
After you have confirmed your service feedback is okay, you can right click View Result Tree to disable it, if you concern it may impact the overall test performance.
Test in Command Line
jmeter -n -t my_test.jmx -l log.jtl
Generate HTML report
jmeter.bat -n -t cms-restful-homepage.jmx -l log.jtl -e -o report
Report dashboard overview:
https://jmeter.apache.org/usermanual/generating-dashboard.html
Test Strategy
- Setup measurement baseline
- Integrate Jmeter Into CI Tool (Jenkins/Bamboo/SonarQube)
- Create Test Plan for DEV, SIT and UAT
Questions:
- Test one service or multiple services per run?
- How many requests per service?
- How many requests per second?
- How to measure it is good or not?
- When to run(trigger) the performance test?
![]()
