本博文jmeter介绍的是在windows下使用,linux后期看情况更新,谢谢
简单介绍,想更多了解的去官方,多的很:
The Apache JMeter™ application is open source software, a 100% pure Java application designed to load test functional behavior and measure performance. It was originally designed for testing Web Applications but has since expanded to other test functions.
What can I do with it?
Apache JMeter may be used to test performance both on static and dynamic resources, Web dynamic applications.
It can be used to simulate a heavy load on a server, group of servers, network or object to test its strength or to analyze overall performance under different load types.
Apache JMeter features include:
-
- Ability to load and performance test many different applications/server/protocol types:
- Web - HTTP, HTTPS (Java, NodeJS, PHP, ASP.NET, …)
- SOAP / REST Webservices
- FTP
- Database via JDBC
- LDAP
- Message-oriented middleware (MOM) via JMS
- Mail - SMTP(S), POP3(S) and IMAP(S)
- Native commands or shell scripts
- TCP
- Java Objects
- Full featured Test IDE that allows fast Test Plan recording (from Browsers or native applications), building and debugging.
- CLI mode (Command-line mode (previously called Non GUI) / headless mode) to load test from any Java compatible OS (Linux, Windows, Mac OSX, …)
- A complete and ready to present dynamic HTML report
- Easy correlation through ability to extract data from most popular response formats, HTML, JSON , XML or any textual format
- Complete portability and 100% Java purity.
- Full multi-threading framework allows concurrent sampling by many threads and simultaneous sampling of different functions by separate thread groups.
- Caching and offline analysis/replaying of test results.
- Highly Extensible core:
- Pluggable Samplers allow unlimited testing capabilities.
- Scriptable Samplers (JSR223-compatible languages like Groovy and BeanShell)
- Several load statistics may be chosen with pluggable timers.
- Data analysis and visualization plugins allow great extensibility as well as personalization.
- Functions can be used to provide dynamic input to a test or provide data manipulation.
- Easy Continuous Integration through 3rd party Open Source libraries for Maven, Gradle and Jenkins.
建议软件大家都从官方下载,最新版,安全可靠值得信赖
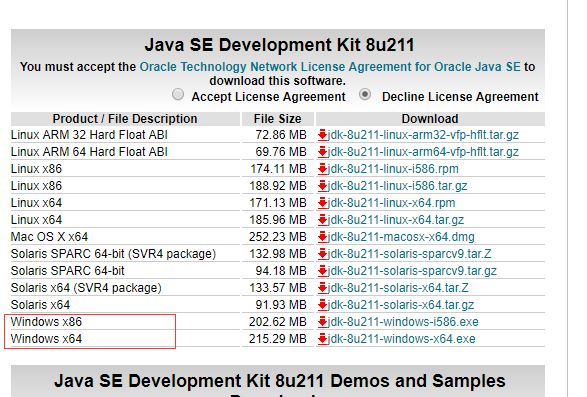
基础了解完了,开始下载吧,jmeter是纯java的程序,需要java环境才能使用,所以先下载一个jdk
java的官方直接下载:https://www.oracle.com/technetwork/java/javase/downloads/jdk8-downloads-2133151.html

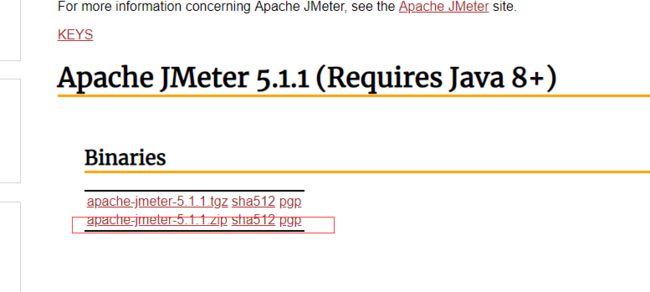
jmeter官方直接下载:https://jmeter.apache.org/download_jmeter.cgi
1、点击下载

2、下载二进制的zip:
别问其他的是干啥的,我也不知道,下载zip就对了

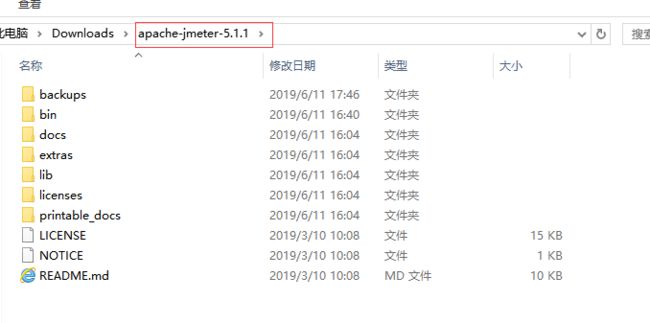
下载完之后进行解压 ,解压之后是这个包:

不需要安装,解压之后直接使用,下面介绍一下每个文件夹的作用,为啥介绍,那肯定有用,萌新铭记呦
1、backups :备份,jmeter项目脚本
2、bin : 启动文件和配置文件
(1)、ApacheJMeter.jar 启动文件
(2)、jmeter.bat cmd 启动文件,后台会开一个cmd窗口
(3)、jmeter.sh linux 启动文件
(4)、jmeter.properties 系统配置文件
(5)、jmeter-server.bat windows 分布式测试 服务器配置
(6)、jmeter-server linux 分布式测试 服务器配置
3、docs : 接口文档目录
4、extras : 扩展插件目录
5、lib : 用到的插件目录,里面都是jar包,jmeter使用过程中会在lib和extras目录下寻找需要的类
6、licenses : 证书目录
7、printable_docs : 用户使用手册,大家自学不懂的时候也可以看里面文档 (有不懂得可以多看看,挺不错的,虽然版本有点老)
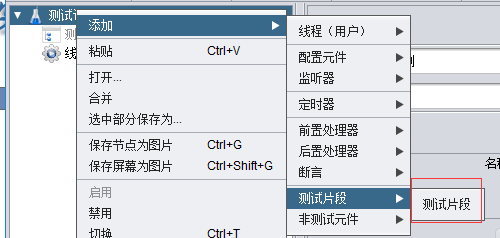
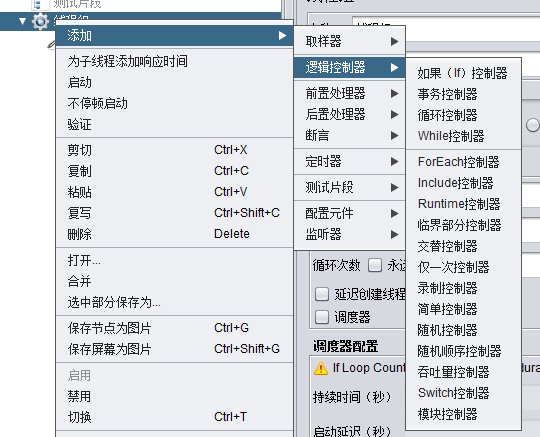
1、性能基本知识 - 先大概过一遍每个插件的大概含义,下面再开始进行性能或接口测试,请看另外博文
测试片段 - 控制器上的一个特殊的线程组,和线程组是一个层级,但是他是不被主动执行的 ,除非它是一个模块控制器或者是被控制器引用才会执行

配置元件 - 用于对静态数据配置的支持 ,如CSV,Data ,config可以将本地数据文件形成数据池

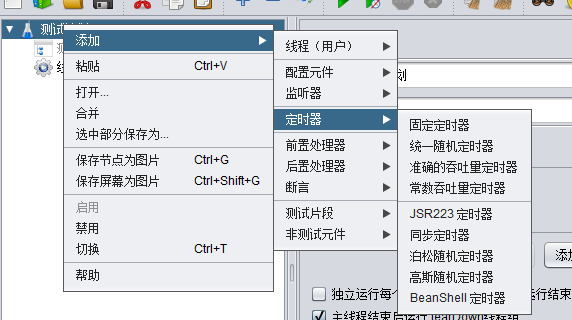
定时器 - 操作之间设置等待时间 ,多种类型定时器,后面可能会用到

前置处理器 - 用于实际的请求发出之前对即将发出的请求进行特殊处理,如HTTP ,URl 重写修复符

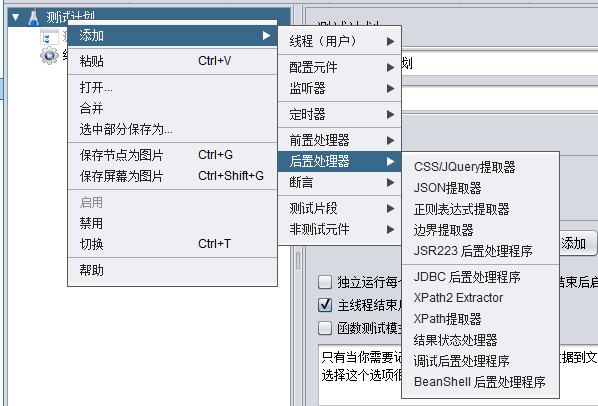
后置处理器 - 对发出请求后得到的服务器响应进行处理,一般用来提取响应中的特定数据

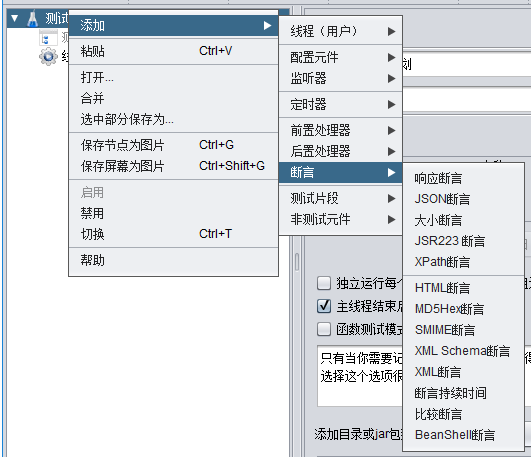
断言 - 用于检测测试中得到的相应数据是否等于预期结果,设置检查点 ,如果没有满足断言则是失败case

监听器 - 用来对测试结果进行处理和可视化展示的一系列, 图形结果,查看结果树,聚合报告,都是常用的

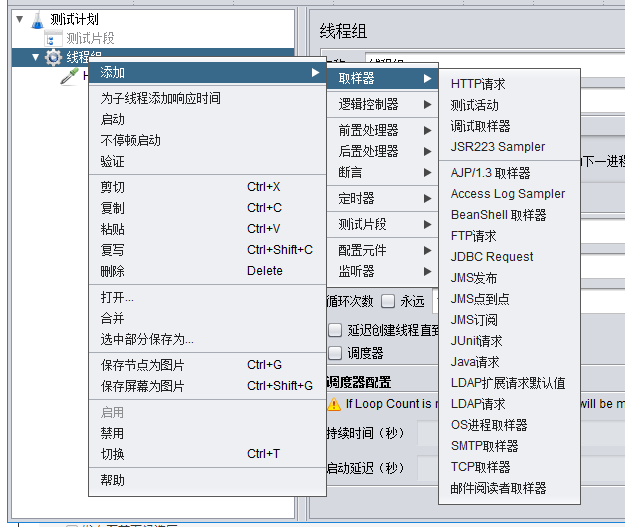
取样器 - 向服务器发送请求,根据不用协议有不用的取样器

逻辑控制器 - 2类 ,一类是用于控制test plan中sampler节点发送请求的逻辑顺序的控制器,一类是用来组织可控制sampler节点的!

用户使用手册里的分布式测试:
| 25. Apache JMeter Distributed Testing Step-by-step |
This short tutorial explains how to use multiple systems to perform stress testing. Before we start, there are a couple of things to check.
- the firewalls on the systems are turned off or correct ports are opened.
- all the clients are on the same subnet.
- the server is in the same subnet, if 192.x.x.x or 10.x.x.x IP addresses are used. If the server doesn't use 192.xx or 10.xx IP address, there shouldn't be any problems.
- Make sure JMeter can access the server.
- Make sure you use the same version of JMeter and Java on all the systems. Mixing versions will not work correctly.
- You have setup SSL for RMI or disabled it.
Once you've made sure the systems are ready, it's time to setup remote testing. The tutorial assumes you already have JMeter installed on all the systems. The way JMeter works is one master controller initiates the test on multiple slave systems.
| In this tutorial we use GUI Mode just for demonstration. In real life you should use CLI mode (NON GUI) to start your load test |
One master controls multiple slaves |
| 25.1 Terminology |
Before we dive into the step-by-step instructions, it's a good idea to define the terms and make sure the definition is clear.
-
Master
-
the system running JMeter GUI, which controls the test
-
Slave
-
the system running
jmeter-server, which takes commands from the GUI and send requests to the target system(s)
-
Target
-
the webserver we plan to stress test
|
| |
| 25.2 Step-by-Step |
- On the slave systems, go to jmeter/bin directory and execute jmeter-server.bat (jmeter-server on unix).
- On master system acting as the console, open windows explorer and go to jmeter/bin directory
- Open jmeter.properties in a text editor
- Edit the line remote_hosts=127.0.0.1
- Add the IP address. For example, if I have JMeter server running on 192.168.0.10, …, 192.168.0.15, the entry would like like this:
|
|
|
|
remote_hosts=192.168.0.10,192.168.0.11,192.168.0.12,192.168.0.13,192.168.0.14 |
|
|
|
|
- Start JMeter.
- Open the test plan you want to use
|
| |
| 25.2 Starting the Test |
At this point, you are ready to start load testing. If you want to double check the slave systems are working, open jmeter.log in your editor. You should see the following in the log.
|
|
|
|
Writing log file to: /XXXX/XXXXX/bin/jmeter-server.log
Created remote object: UnicastServerRef [liveRef: [endpoint:[192.X.X.X:XXXXX](local),objID:[-6a665beb:15a2c8b9419:-7fff, 3180474504933847586]]]
|
|
|
|
|
If you do not see this message, it means jmeter-server did not start correctly. For tips on debugging the issue, go to the tips section. There are two ways to initiate the test: a single system and all systems.
|
| |
| 25.3 Start a single clients |
- Click Run at the top
- Select Remote Start
- Select the IP address
|
| |
| 25.4 Start all clients |
- Click Run at the top
- Select Remote Start all or use Ctrl + Shift + R
|
| |
| 25.5 Limitations |
There are some basic limitations for distributed testing. Here's the list of the known items in no specific order.
- RMI cannot communicate across subnets without a proxy; therefore neither can JMeter without a proxy.
- Since version 2.9, JMeter sends all the test results stripping Response data to the controlling console, this allows us to reduce impact on network IO. Ensure you monitor your network traffic so that this traffic does not incur contention
- A single JMeter client running on a 2-3 GHz CPU (recent CPU) can handle 1000-2000 threads depending on the type of test.
|
| |
| 25.6 Additional resources |
Wiki page on remote testing
Remote Testing in the user manual
|
| |
| 25.7 Tips |
In some cases, the firewall may still be blocking RMI traffic.
Anti Virus and Firewall
| Antivirus should be stopped during a Load Test as it can drastically impact timings leading to wrong results. |
Firewall needs to be stopped from windows services or at least some ports need to be opened.
- Open control panel
- Open administrative tools
- Double click services
- Go to down to Symantec anti virus, right click and select stop
Windows firewall
- Open network connections
- Select the network connection
- Right click and select properties
- Select advanced tab
- Uncheck internet connection firewall
Linux
On Linux, iptables might be turned on by default. For instructions, please refer to the Remote Testing in the user manual
On RedHat (or derivatives), iptables is turned on by default. Execute
to stop the Linux firewall or ensure you open the correct ports.
|
|
