CentOS 7 下 Prometheus 部署
文章目录
- CentOS 7 下 Prometheus 部署
-
-
- 环境准备
-
-
- 服务器信息
- 关闭防火墙 && SELinux
-
- Prometheus 部署
-
-
- 安装包准备
- 解压安装包 && 安装
- 添加 prometheus 用户
- 创建目录 && 赋权
- 配置开机启动脚本
- 启动 Prometheus 服务
- 查看 Prometheus 状态
- Prometheus 配置
-
- Node Exporter 部署
-
-
- 安装包准备
- 解压安装包 && 安装
- Node Exporter 目录赋权
- 配置开机启动脚本
- 启动 Node Exporter 服务
- 查看 Node Exporter 状态
- Prometheus 监控 Node Exporter 配置
- 重启 Prometheus
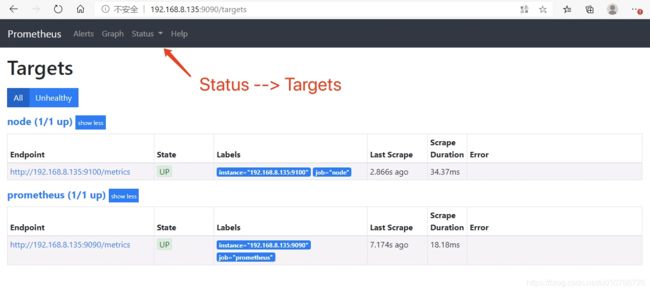
- Web 页面验证
-
- AlertManager 部署
-
-
- 安装包准备
- 解压安装包 && 安装
- AlertManager 数据目录创建 && 目录赋权
- 配置开机启动脚本
- 启动 AlertManager 服务
- 查看 AlertManager 状态
- Prometheus 监控 AlertManager 配置
- 重启 Prometheus
- Web 页面验证
-
- Grafana 部署
-
-
- 安装包准备
- 解压安装包 && 安装
- Grafana 目录赋权
- Grafana 配置文件配置
- 配置开机启动脚本
- 启动 Grafana 服务
- 查看 Grafana 状态
- Grafana 导入 Prometheus 数据
- Grafana Dashboards Import
-
-
CentOS 7 下 Prometheus 部署
环境准备
服务器信息
| 主机名 | 操作系统 | IP | CPU | 内存 | 部署组件 | 端口 | 描述 |
|---|---|---|---|---|---|---|---|
| prometheus | CentOS 7.3 | 192.168.8.135 | 2核 | 8GB | Prometheus Server Grafana Node Exporter Alertmanager |
9090 3000 9100 9093 |
— |
| — | — | — | — | — | — | — | — |
关闭防火墙 && SELinux
[root@prometheus ~]# systemctl stop firewalld && systemctl disable firewalld
Removed symlink /etc/systemd/system/dbus-org.fedoraproject.FirewallD1.service.
Removed symlink /etc/systemd/system/basic.target.wants/firewalld.service.
[root@prometheus ~]# sed -i 's/=enforcing/=disabled/g' /etc/selinux/config && setenforce 0
Prometheus 部署
安装包准备
[root@prometheus ~]# cd /soft/prometheus/
[root@prometheus prometheus]# wget https://github.com/prometheus/prometheus/releases/download/v2.20.1/prometheus-2.20.1.linux-amd64.tar.gz
解压安装包 && 安装
[root@prometheus prometheus]# tar -zxf prometheus-2.20.1.linux-amd64.tar.gz
[root@prometheus prometheus]# mv prometheus-2.20.1.linux-amd64 /usr/local/prometheus
添加 prometheus 用户
[root@prometheus prometheus]# useradd -M -s /sbin/nologin prometheus
创建目录 && 赋权
[root@prometheus prometheus]# mkdir -p /data/prometheus
[root@prometheus prometheus]# chown -R prometheus:prometheus /usr/local/prometheus /data/prometheus
配置开机启动脚本
[root@prometheus prometheus]# cat /usr/lib/systemd/system/prometheus.service
[Unit]
Description=Prometheus
After=network.target

[Service]
Type=simple
Environment="GOMAXPROCS=4"
User=prometheus
Group=prometheus
ExecReload=/bin/kill -HUP $MAINPID
ExecStart=/usr/local/prometheus/prometheus \
  --config.file=/usr/local/prometheus/prometheus.yml \
  --storage.tsdb.path=/data/prometheus \
  --storage.tsdb.retention=30d \
  --web.console.libraries=/usr/local/prometheus/console_libraries \
  --web.console.templates=/usr/local/prometheus/consoles \
  --web.listen-address=0.0.0.0:9090 \
  --web.read-timeout=5m \
  --web.max-connections=10 \
  --query.max-concurrency=20 \
  --query.timeout=2m \
  --web.enable-lifecycle
PrivateTmp=true
PrivateDevices=true
ProtectHome=true
NoNewPrivileges=true
LimitNOFILE=infinity
ReadWriteDirectories=/data/prometheus
ProtectSystem=full

SyslogIdentifier=prometheus
Restart=always

[Install]
WantedBy=multi-user.target
启动 Prometheus 服务
[root@prometheus prometheus]# systemctl daemon-reload && systemctl enable prometheus && systemctl start prometheus
Created symlink from /etc/systemd/system/multi-user.target.wants/prometheus.service to /usr/lib/systemd/system/prometheus.service.
查看 Prometheus 状态
- systemctl 方式
[root@prometheus prometheus]# systemctl status prometheus
● prometheus.service - Prometheus
   Loaded: loaded (/usr/lib/systemd/system/prometheus.service; enabled; vendor preset: disabled)
   Active: active (running) since Mon 2020-08-17 16:21:38 CST; 1min 11s ago
 Main PID: 2350 (prometheus)
   CGroup: /system.slice/prometheus.service
           └─2350 /usr/local/prometheus/prometheus --config.file=/usr/local/prometheus/prometheus.yml --storage.tsdb.path=/data/prometheus --storage....

Aug 17 16:21:38 prometheus prometheus[2350]: level=info ts=2020-08-17T08:21:38.910Z caller=head.go:641 component=tsdb msg="Replaying on-disk ... if any"
Aug 17 16:21:38 prometheus prometheus[2350]: level=info ts=2020-08-17T08:21:38.910Z caller=head.go:655 component=tsdb msg="On-disk memory map…on=6.145µs
Aug 17 16:21:38 prometheus prometheus[2350]: level=info ts=2020-08-17T08:21:38.910Z caller=head.go:661 component=tsdb msg="Replaying WAL, thi...a while"
Aug 17 16:21:38 prometheus prometheus[2350]: level=info ts=2020-08-17T08:21:38.910Z caller=head.go:713 component=tsdb msg="WAL segment loaded...egment=0
Aug 17 16:21:38 prometheus prometheus[2350]: level=info ts=2020-08-17T08:21:38.910Z caller=head.go:716 component=tsdb msg="WAL replay complet…=296.721µs
Aug 17 16:21:38 prometheus prometheus[2350]: level=info ts=2020-08-17T08:21:38.911Z caller=main.go:700 fs_type=EXT4_SUPER_MAGIC
Aug 17 16:21:38 prometheus prometheus[2350]: level=info ts=2020-08-17T08:21:38.911Z caller=main.go:701 msg="TSDB started"
Aug 17 16:21:38 prometheus prometheus[2350]: level=info ts=2020-08-17T08:21:38.911Z caller=main.go:805 msg="Loading configuration file" filen...heus.yml
Aug 17 16:21:38 prometheus prometheus[2350]: level=info ts=2020-08-17T08:21:38.920Z caller=main.go:833 msg="Completed loading of configuratio...heus.yml
Aug 17 16:21:38 prometheus prometheus[2350]: level=info ts=2020-08-17T08:21:38.920Z caller=main.go:652 msg="Server is ready to receive web requests."
Hint: Some lines were ellipsized, use -l to show in full.
- 端口方式
[root@prometheus prometheus]# netstat -ntlp | grep 9090
tcp6       0      0 :::9090                 :::*                    LISTEN      2350/prometheus
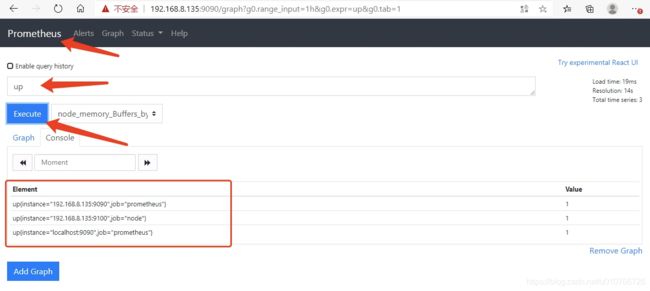
- web 页面方式

Prometheus 配置
[root@prometheus prometheus]# cat /usr/local/prometheus/prometheus.yml | grep -v '^$' | grep -v '^#'
global:
  scrape_interval:     15s # Set the scrape interval to every 15 seconds. Default is every 1 minute.
  evaluation_interval: 15s # Evaluate rules every 15 seconds. The default is every 1 minute.
  # scrape_timeout is set to the global default (10s).
alerting:
  alertmanagers:
  - static_configs:
    - targets:
      # - alertmanager:9093
rule_files:
  # - "first_rules.yml"
  # - "second_rules.yml"
scrape_configs:
  # The job name is added as a label `job=` to any timeseries scraped from this config.
  - job_name: 'prometheus'
    # metrics_path defaults to '/metrics'
    # scheme defaults to 'http'.
    static_configs:
    # - targets: ['localhost:9090']
    - targets: ['192.168.8.135:9090']
Node Exporter 部署
安装包准备
[root@prometheus prometheus]# cd /soft/prometheus
[root@prometheus prometheus]# wget https://github.com/prometheus/node_exporter/releases/download/v1.0.1/node_exporter-1.0.1.linux-amd64.tar.gz
解压安装包 && 安装
[root@prometheus prometheus]# tar -zxf node_exporter-1.0.1.linux-amd64.tar.gz
[root@prometheus prometheus]# mv node_exporter-1.0.1.linux-amd64 /usr/local/node_exporter
Node Exporter 目录赋权
[root@prometheus prometheus]# chown -R prometheus:prometheus /usr/local/node_exporter
配置开机启动脚本
[root@prometheus prometheus]# cat /usr/lib/systemd/system/node_exporter.service
[Unit]
Description=node_exporter
After=network.target

[Service]
Type=simple
User=prometheus
Group=prometheus
ExecStart=/usr/local/node_exporter/node_exporter \
  --web.listen-address=0.0.0.0:9100 \
  --web.telemetry-path=/metrics \
  --log.level=info \
  --log.format=logfmt
Restart=always

[Install]
WantedBy=multi-user.target
启动 Node Exporter 服务
[root@prometheus prometheus]# systemctl daemon-reload && systemctl enable node_exporter && systemctl start node_exporter
Created symlink from /etc/systemd/system/multi-user.target.wants/node_exporter.service to /usr/lib/systemd/system/node_exporter.service.
查看 Node Exporter 状态
- systemctl 方式
[root@prometheus prometheus]# systemctl status node_exporter
● node_exporter.service - node_exporter
   Loaded: loaded (/usr/lib/systemd/system/node_exporter.service; enabled; vendor preset: disabled)
   Active: active (running) since Mon 2020-08-17 16:46:02 CST; 1min 31s ago
 Main PID: 16125 (node_exporter)
   CGroup: /system.slice/node_exporter.service
           └─16125 /usr/local/node_exporter/node_exporter --web.listen-address=0.0.0.0:9100 --web.telemetry-path=/metrics --log.level=info --log.form...

Aug 17 16:46:02 prometheus node_exporter[16125]: level=info ts=2020-08-17T08:46:02.885Z caller=node_exporter.go:112 collector=thermal_zone
Aug 17 16:46:02 prometheus node_exporter[16125]: level=info ts=2020-08-17T08:46:02.885Z caller=node_exporter.go:112 collector=time
Aug 17 16:46:02 prometheus node_exporter[16125]: level=info ts=2020-08-17T08:46:02.885Z caller=node_exporter.go:112 collector=timex
Aug 17 16:46:02 prometheus node_exporter[16125]: level=info ts=2020-08-17T08:46:02.885Z caller=node_exporter.go:112 collector=udp_queues
Aug 17 16:46:02 prometheus node_exporter[16125]: level=info ts=2020-08-17T08:46:02.885Z caller=node_exporter.go:112 collector=uname
Aug 17 16:46:02 prometheus node_exporter[16125]: level=info ts=2020-08-17T08:46:02.885Z caller=node_exporter.go:112 collector=vmstat
Aug 17 16:46:02 prometheus node_exporter[16125]: level=info ts=2020-08-17T08:46:02.885Z caller=node_exporter.go:112 collector=xfs
Aug 17 16:46:02 prometheus node_exporter[16125]: level=info ts=2020-08-17T08:46:02.885Z caller=node_exporter.go:112 collector=zfs
Aug 17 16:46:02 prometheus node_exporter[16125]: level=info ts=2020-08-17T08:46:02.885Z caller=node_exporter.go:191 msg="Listening on" addres...0.0:9100
Aug 17 16:46:02 prometheus node_exporter[16125]: level=info ts=2020-08-17T08:46:02.885Z caller=tls_config.go:170 msg="TLS is disabled and it ...p2=false
Hint: Some lines were ellipsized, use -l to show in full.
- 端口方式
[root@prometheus prometheus]# netstat -ntlp | grep 9100
tcp6       0      0 :::9100                 :::*                    LISTEN      16125/node_exporter
Prometheus 监控 Node Exporter 配置
# 修改前
scrape_configs:
  - job_name: 'prometheus'
    static_configs:
    - targets: ['192.168.8.135:9090']

# 修改后
scrape_configs:
  - job_name: 'prometheus'
    static_configs:
    - targets: ['192.168.8.135:9090']

  - job_name: 'node'
    static_configs:
      - targets: ['192.168.8.135:9100']
重启 Prometheus
[root@prometheus prometheus]# systemctl restart prometheus
Web 页面验证
AlertManager 部署
安装包准备
[root@prometheus prometheus]# cd /soft/prometheus/
[root@prometheus prometheus]# wget https://github.com/prometheus/alertmanager/releases/download/v0.21.0/alertmanager-0.21.0.linux-amd64.tar.gz
解压安装包 && 安装
[root@prometheus prometheus]# tar -zxf alertmanager-0.21.0.linux-amd64.tar.gz
[root@prometheus prometheus]# mv alertmanager-0.21.0.linux-amd64 /usr/local/alertmanager
AlertManager 数据目录创建 && 目录赋权
[root@prometheus prometheus]# mkdir /usr/local/alertmanager/data
[root@prometheus prometheus]# chown -R prometheus:prometheus /usr/local/alertmanager
配置开机启动脚本
[root@prometheus prometheus]# cat /usr/lib/systemd/system/alertmanager.service
[Unit]
Description=Alertmanager
After=network.target

[Service]
Type=simple
User=prometheus
Group=prometheus
ExecStart=/usr/local/alertmanager/alertmanager \
  --config.file=/usr/local/alertmanager/alertmanager.yml \
  --storage.path=/usr/local/alertmanager/data \
  --web.listen-address=0.0.0.0:9093 \
  --cluster.listen-address=0.0.0.0:9094 \
  --log.level=info \
  --log.format=logfmt
Restart=always

[Install]
WantedBy=multi-user.target
启动 AlertManager 服务
[root@prometheus prometheus]# systemctl daemon-reload && systemctl enable alertmanager && systemctl start alertmanager
Created symlink from /etc/systemd/system/multi-user.target.wants/alertmanager.service to /usr/lib/systemd/system/alertmanager.service.
查看 AlertManager 状态
- systemctl 方式
[root@prometheus prometheus]# systemctl status alertmanager
● alertmanager.service - Alertmanager
   Loaded: loaded (/usr/lib/systemd/system/alertmanager.service; enabled; vendor preset: disabled)
   Active: active (running) since Mon 2020-08-17 17:02:48 CST; 1min 9s ago
 Main PID: 16218 (alertmanager)
   CGroup: /system.slice/alertmanager.service
           └─16218 /usr/local/alertmanager/alertmanager --config.file=/usr/local/alertmanager/alertmanager.yml --storage.path=/usr/local/alertmanager...

Aug 17 17:02:48 prometheus systemd[1]: Starting Alertmanager...
Aug 17 17:02:48 prometheus alertmanager[16218]: level=info ts=2020-08-17T09:02:48.606Z caller=main.go:216 msg="Starting Alertmanager" version...7c021d)"
Aug 17 17:02:48 prometheus alertmanager[16218]: level=info ts=2020-08-17T09:02:48.606Z caller=main.go:217 build_context="(go=go1.14.4, user=r...:54:02)"
Aug 17 17:02:48 prometheus alertmanager[16218]: level=info ts=2020-08-17T09:02:48.608Z caller=cluster.go:161 component=cluster msg="setting a...ort=9094
Aug 17 17:02:48 prometheus alertmanager[16218]: level=info ts=2020-08-17T09:02:48.611Z caller=cluster.go:623 component=cluster msg="Waiting f...erval=2s
Aug 17 17:02:48 prometheus alertmanager[16218]: level=info ts=2020-08-17T09:02:48.641Z caller=coordinator.go:119 component=configuration msg=...ager.yml
Aug 17 17:02:48 prometheus alertmanager[16218]: level=info ts=2020-08-17T09:02:48.642Z caller=coordinator.go:131 component=configuration msg=...ager.yml
Aug 17 17:02:48 prometheus alertmanager[16218]: level=info ts=2020-08-17T09:02:48.644Z caller=main.go:485 msg=Listening address=0.0.0.0:9093
Aug 17 17:02:50 prometheus alertmanager[16218]: level=info ts=2020-08-17T09:02:50.611Z caller=cluster.go:648 component=cluster msg="gossip no...0191813s
Aug 17 17:02:58 prometheus alertmanager[16218]: level=info ts=2020-08-17T09:02:58.612Z caller=cluster.go:640 component=cluster msg="gossip se...1444531s
Hint: Some lines were ellipsized, use -l to show in full.
- 端口方式
[root@prometheus prometheus]# netstat -ntlp | grep alertmanager
tcp6       0      0 :::9093                 :::*                    LISTEN      16218/alertmanager
tcp6       0      0 :::9094                 :::*                    LISTEN      16218/alertmanager
- web 方式
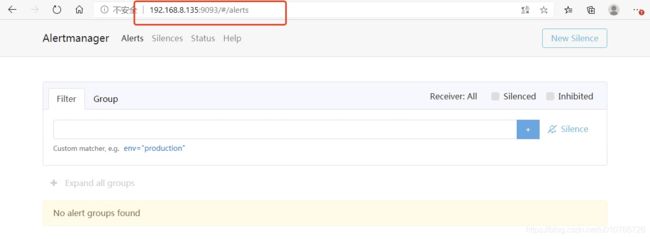
Prometheus 监控 AlertManager 配置
# 修改前
scrape_configs:
  - job_name: 'prometheus'
    static_configs:
    - targets: ['192.168.8.135:9090']

  - job_name: 'node'
    static_configs:
      - targets: ['192.168.8.135:9100']

# 修改后
scrape_configs:
  - job_name: 'prometheus'
    static_configs:
    - targets: ['192.168.8.135:9090']

  - job_name: 'node'
    static_configs:
      - targets: ['192.168.8.135:9100']

  - job_name: 'alertmanager'
    static_configs:
      - targets: ['192.168.8.135:9093']
重启 Prometheus
[root@prometheus prometheus]# systemctl restart prometheus
Web 页面验证
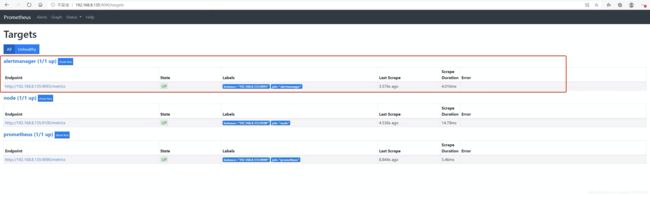
Grafana 部署
安装包准备
[root@prometheus prometheus]# cd /soft/prometheus/
[root@prometheus prometheus]# wget https://dl.grafana.com/oss/release/grafana-7.1.3.linux-amd64.tar.gz
[root@prometheus prometheus]# wget https://dl.grafana.com/oss/release/grafana-7.1.3-1.x86_64.rpm
解压安装包 && 安装
[root@prometheus prometheus]# tar -zxf grafana-7.1.3.linux-amd64.tar.gz
[root@prometheus prometheus]# mv grafana-7.1.3 /usr/local/grafana
Grafana 目录赋权
[root@prometheus prometheus]# mkdir /usr/local/grafana/{data,log}
[root@prometheus prometheus]# chown -R prometheus:prometheus /usr/local/grafana
Grafana 配置文件配置
[root@prometheus prometheus]# cd /usr/local/grafana/conf/
[root@prometheus conf]# cp defaults.ini grafana.ini
[root@prometheus conf]# vim grafana.ini

# logs = data/log
logs = log
配置开机启动脚本
[root@prometheus grafana]# cat /usr/lib/systemd/system/grafana-server.service
[Unit]
Description=Grafana instance
Documentation=http://docs.grafana.org
Wants=network-online.target
After=network-online.target
After=postgresql.service mariadb.service mysqld.service

[Service]
Type=simple
User=prometheus
Group=prometheus
WorkingDirectory=/usr/local/grafana
ExecStart=/usr/local/grafana/bin/grafana-server \
    --config=/usr/local/grafana/conf/grafana.ini \
    --pidfile=/usr/local/grafana/grafana-server.pid

Restart=on-failure
LimitNOFILE=10000
TimeoutStopSec=20

[Install]
WantedBy=multi-user.target
启动 Grafana 服务
[root@prometheus prometheus]# systemctl daemon-reload && systemctl enable grafana-server && systemctl start grafana-server
Created symlink from /etc/systemd/system/multi-user.target.wants/grafana-server.service to /usr/lib/systemd/system/grafana-server.service.
查看 Grafana 状态
- systemclt 方式
[root@prometheus conf]# systemctl status grafana-server
● grafana-server.service - Grafana instance
   Loaded: loaded (/usr/lib/systemd/system/grafana-server.service; enabled; vendor preset: disabled)
   Active: active (running) since Mon 2020-08-17 19:56:36 CST; 8s ago
     Docs: http://docs.grafana.org
 Main PID: 17852 (grafana-server)
   CGroup: /system.slice/grafana-server.service
           └─17852 /usr/local/grafana/bin/grafana-server --config=/usr/local/grafana/conf/grafana.ini --pidfile=/usr/local/grafana/grafana-server.pid...

Aug 17 19:56:43 prometheus grafana-server[17852]: t=2020-08-17T19:56:43+0800 lvl=info msg="Executing migration" logger=migrator id="Update al...charset"
Aug 17 19:56:44 prometheus grafana-server[17852]: t=2020-08-17T19:56:44+0800 lvl=info msg="Executing migration" logger=migrator id="create no...able v1"
Aug 17 19:56:44 prometheus grafana-server[17852]: t=2020-08-17T19:56:44+0800 lvl=info msg="Executing migration" logger=migrator id="add index...fier_id"
Aug 17 19:56:44 prometheus grafana-server[17852]: t=2020-08-17T19:56:44+0800 lvl=info msg="Executing migration" logger=migrator id="drop aler...journal"
Aug 17 19:56:44 prometheus grafana-server[17852]: t=2020-08-17T19:56:44+0800 lvl=info msg="Executing migration" logger=migrator id="create al...able v1"
Aug 17 19:56:44 prometheus grafana-server[17852]: t=2020-08-17T19:56:44+0800 lvl=info msg="Executing migration" logger=migrator id="add index...fier_id"
Aug 17 19:56:44 prometheus grafana-server[17852]: t=2020-08-17T19:56:44+0800 lvl=info msg="Executing migration" logger=migrator id="Add for t...t table"
Aug 17 19:56:44 prometheus grafana-server[17852]: t=2020-08-17T19:56:44+0800 lvl=info msg="Executing migration" logger=migrator id="Add colum...ication"
Aug 17 19:56:44 prometheus grafana-server[17852]: t=2020-08-17T19:56:44+0800 lvl=info msg="Executing migration" logger=migrator id="Update ui...ication"
Aug 17 19:56:44 prometheus grafana-server[17852]: t=2020-08-17T19:56:44+0800 lvl=info msg="Executing migration" logger=migrator id="Add uniqu..._id_uid"
Hint: Some lines were ellipsized, use -l to show in full.
- 端口方式
[root@prometheus conf]# netstat -ntlp | grep grafana-serve
tcp6       0      0 :::3000                 :::*                    LISTEN      17852/grafana-serve
-
web 方式

-
初次登录 – 更改密码

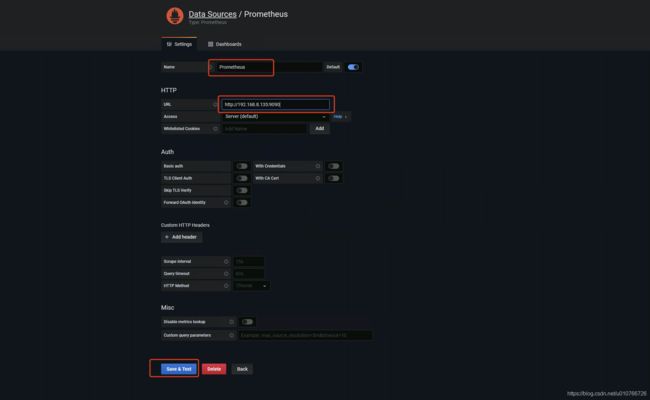
Grafana 导入 Prometheus 数据
- settings --> Data Sources --> Add data Source

- Select Prometheus

- Prometheus URL Setting
Grafana Dashboards Import
- Dashboards --> Manage --> Import
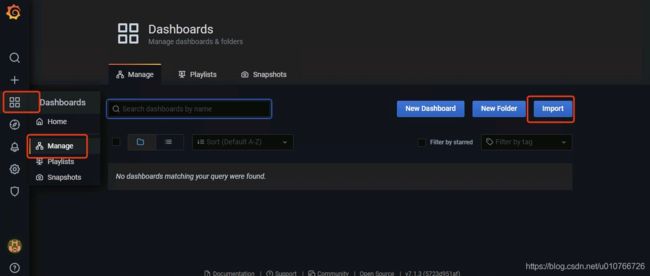
- Dashboards 官网