echarts的地图热力点标注鼠标悬停显示提示内容
在做中国地图上面的热力点标注的时候遇到提示格式不是我想要的的问题,后来做了更改就可以了。
首先贴出我请求回来数据格式
list: [{latitude: "22.522910", longitude: "114.054540", num: "3", zone1: "A", province: "广东"}
0: {latitude: "22.522910", longitude: "114.054540", num: "3", zone1: "A", province: "广东"}
1: {latitude: "22.630444", longitude: "113.972534", num: "20", zone1: "南山", province: "广东"}
2: {latitude: "22.561370", longitude: "113.941790", num: "10", zone1: "宝安", province: "广东"}
3: {latitude: "22.546230", longitude: "114.086950", num: "4", zone1: "福田", province: "广东"}
4: {latitude: "31.802210", longitude: "115.404900", num: "50", zone1: "商城县", province: "河南"}]
这是请求回来的list,需要进行处理
chinaConfigure(data) {
      var series = JSON.parse(JSON.stringify(data));
      var legendData = [];
      for(let i = 0; i < series.length; i++) {
          legendData.push({name:series[i].province,value:series[i].num});
      }

      for(var i = 0; i < this.list.length; i++){
        this.geoData.push({name:this.list[i].zone1,value:this.list[i].num});
        this.geoArr.push({key:this.list[i].zone1,value:[this.list[i].longitude,this.list[i].latitude]});
        this.geoCoordMap[this.list[i].zone1] = [this.list[i].longitude,this.list[i].latitude];
      }

      let echart = echarts.init(document.getElementById("echarts"));

      var option = {
        tooltip: {},
        visualMap: {
          min: 0,
          max: 1500,
          left: "left",
          top: "bottom",
          // text: ["High", "Low"],
          seriesIndex: [1],
          inRange: {
            color: ["#01C86D","#3280d5" ]
          },
          calculable: true
        },
        dataRange: {
          show:false,
          min: 0,
          max: 1000,
          x: 'left',
          y: 'bottom',
          text: ["High", "Low"],
          inRange: {
            color: ["#01C86D","#3280d5" ]
          },
          calculable: true
        },
        geo: {
          map: "china",
          roam: true,
          zoom:1, //默认显示级别
          scaleLimit:{min:0,max:3}, // 缩放级别
          label: {
            normal: {
              show: true,
              textStyle: {
                color: "#F0F8FB"
              }
            },
            emphasis: { // 对应的鼠标悬浮效果
              show: false,
              textStyle: {
                  color: "#F0F8FB"
              }
            }
          },
          itemStyle: {
            normal: {
              areaColor: '#3280d5',
              borderColor: "rgba(0, 0, 0, 0.2)"
            },
            emphasis: {
              borderWidth: 0,
              borderColor: '#0066ba',
              areaColor: "#00C76C",
              shadowColor: 'rgba(0, 0, 0, 0.5)'
            }
          },
          regions: [
            {
              name: "南海诸岛",
              value: 0,
              itemStyle: {
                normal: {
                  opacity: 0,
                  label: {
                    show: false
                  }
                }
              }
            }
          ]
        },
        series: [
          {
            tooltip: {
              // trigger: 'item',
              // "confine": true,
              // "formatter": (p)=>{//自定义提示信息
              //   let dataCon = p.data;
              //   let txtCon =dataCon.name+':'+dataCon.value[2];
              //   return txtCon;
              // }
            },
            type: "scatter",
            roam: true,
            coordinateSystem: "geo",
            data: this.convertData(this.geoData),
            showAllSymbol: true,
            symbolSize: 20,
            symbol:
              "image://data:image/png;base64,iVBORw0KGgoAAAANSUhEUgAAABMAAAATCAMAAABFjsb+AAAArlBMVEUAAACqqgD//wC/vwD//wDV1Sv//yvq6hX/6hX/6xTt7RL/7ST27Rr27hr37h737x338Bv48Br48B747R337x337x337x338Bz38Bz47hv48Bv27xv27x347x328B358Bz28Bz58Bz37hv58B337x358R337x337xz47xv27xv47xz37xv37xz58B358B358B348Bv58Bv38Bz48Rz38Bz38B337xv37xv48BzEer9hAAAAOHRSTlMAAwMEBAYGDAwNDg46Ozw+Q0RFR2BhYmRlaGhyc3N0dnd3e3t8fH2Ajo+QocvLzPDy8vf3+Pn8/ZxQyHYAAAABYktHRDnXAJVAAAAAnElEQVQY03WQxxKCUBAExywGzGLAiNqYEPP7/y/zQIFaYh+ntnZ3WpIkyx64C3dgW4rJtzwils1cFJUd3jglSSqO+GRYkNQB8IPwEh59gLZUXQH7mzHGmOse8CpqALu7ibhtAVt9IDAxB6CnKRAm2QlwtQGeSfYA1pr8zI1T99V/7tZS/4t7nM056aFs96tvN/PHS6q/yPOcWez5Bam3MAvM/3lWAAAAAElFTkSuQmCC",
            symbolRotate: 35,
            label: {
              normal: {
                formatter: "{b}",
                position: "right",
                show: false
              },
              emphasis: {
                show: true,
              }
            },
            itemStyle: {
              normal: {
                areaColor: "#00C76C",
              }
            }
          },
          {
            name: "场站数",
            type: "map",
            geoIndex: 0,
            data:legendData,
          }
        ]
      };
      echart.setOption(option);
    },
上面代码中geoCoordMap是用来存放标注的经纬度,把请求回来的list遍历出经纬度和地区,添加到空对象中大概格式如下
geoCoordMap: {
        // 南山: [113.972534, 22.630444],
        // A: ["114.054540", "22.522910"],
        // 南山: ["113.972534", "22.630444"],
        // 商城县: ["115.404900", "31.802210"],
        // 宝安:  ["113.941790", "22.561370"],
        // 福田: ["114.086950", "22.546230"],
      },
整理成如上对象之后,还需要在函数中定义格式如下
convertData(data) {
      var res = [];
      for (var i = 0; i < data.length; i++) {
        var geoCoord = this.geoCoordMap[data[i].name];
        if (geoCoord) {
          res.push({
            name: data[i].name,
            value: geoCoord.concat(data[i].value)
          });
        }
      }
      return res;
    },
写到这里呢鼠标悬停就出现了提示但是格式不是我想要的,格式如下
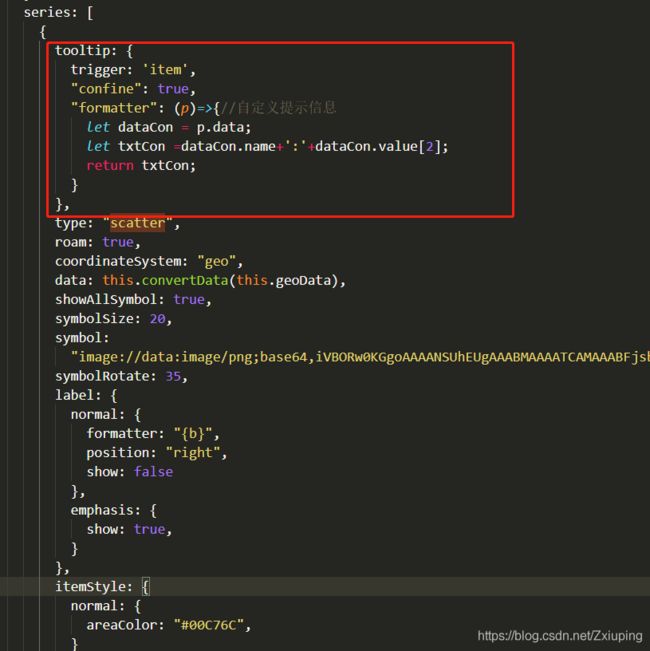
这个格式是地区下面拼接这经度,但是我想要地区后面跟着实际数据,需要在tooltip中重新定义格式代码如下
tooptip中的formatter属性中可以自定义提示内容,这样写之后提示内容就变成了下图这样的
这个就是我想要的格式了,地区名字后面紧跟数量而不是默认的经纬度,具体代码在上面也有贴出。


