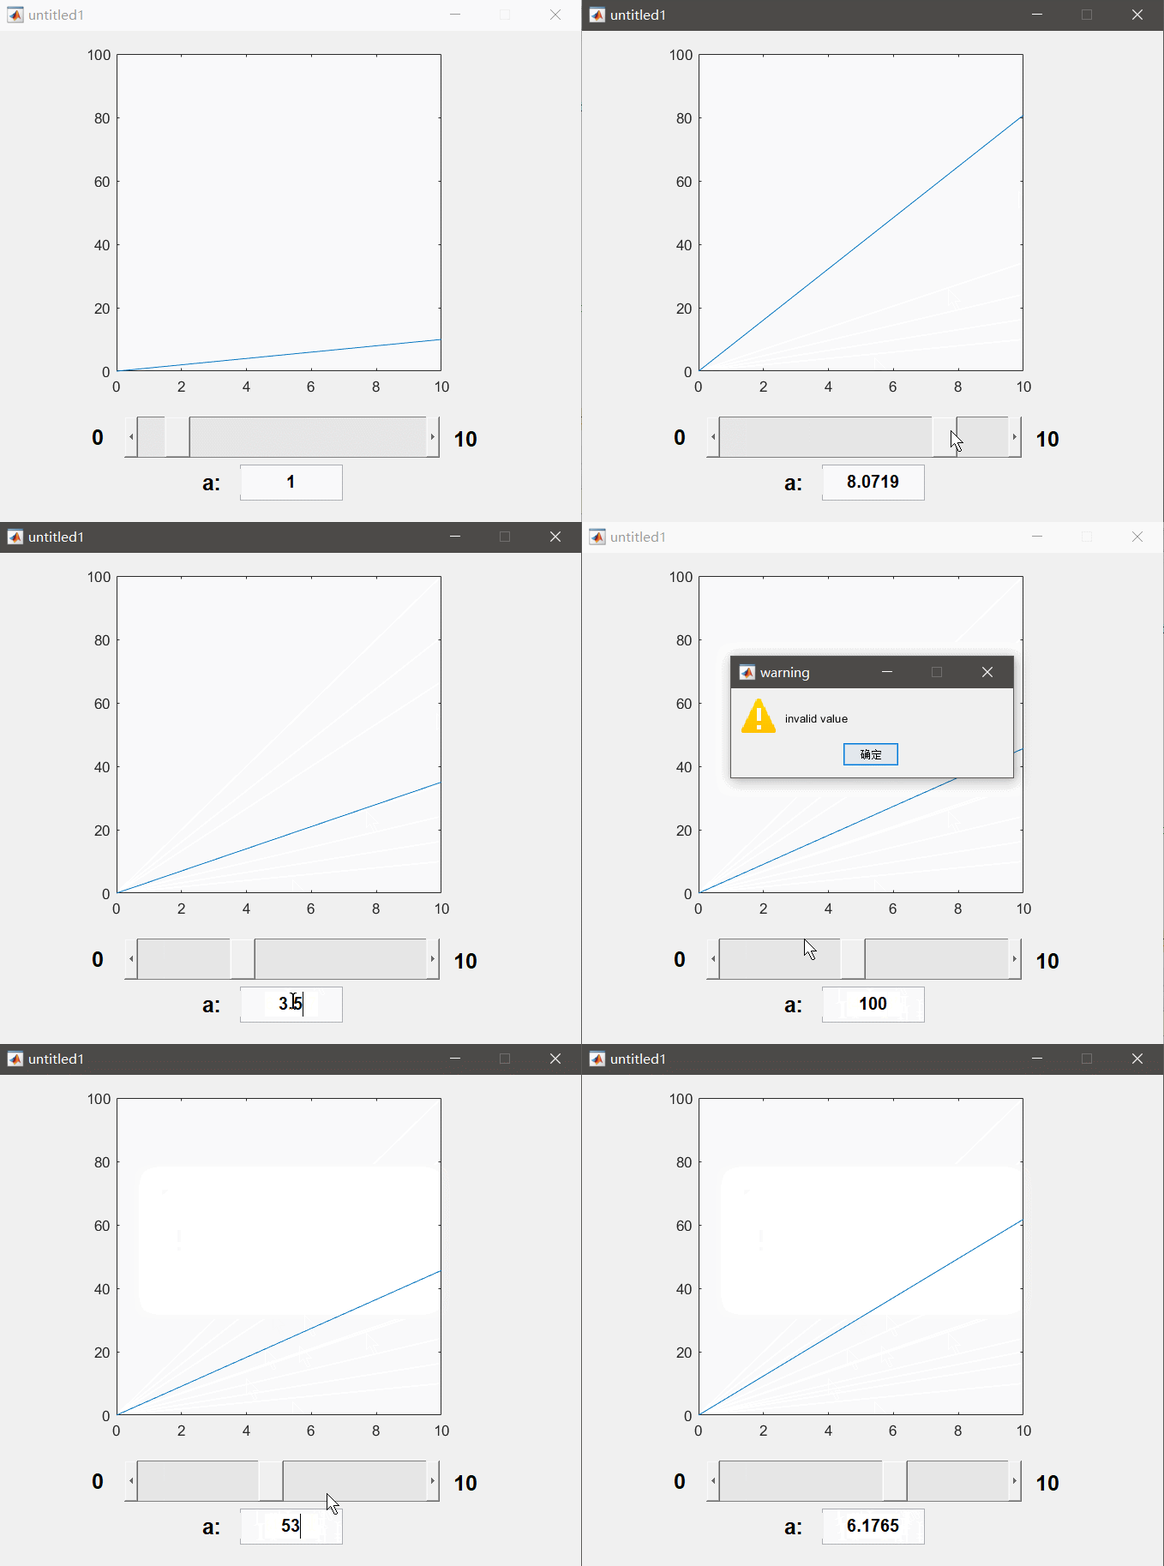
Matlab的GUI的slider滑动条和edit动态文本框联合使用例程
代码链接:https://download.csdn.net/download/benchuspx/12404653
今天想用matlab的plot画个函数的曲线图,函数有一个参数a可以调,不同的a对应不同的曲线图。为了方便观察a的改变对曲线的影响,我想做一个简单的GUI用户界面,通过界面上的slider滑动条拖动改变a,或者从动态文本框输入a,这样可以实时观察曲线图的变化。
结果网上找了一堆资料全都零零散散,连这么简单的功能都没个完整的教程。于是根据自己学的写一个。
以y=ax的plot为例,效果如下。这里用到的代码可以在我的资源里下载。
链接地址点这
MATLAB版本为2018b
gifcam是个好东西,动图都靠它
操作如下:
新建GUI窗口
命令行输入guide,可以进入matlab的GUI功能。后面如果要修改GUI窗口的属性,也可以这样输入guide,然后打开现有GUI。
下面新建一个GUI。

然后就是傻瓜操作,画布大小可以改。把作图区、动态文本框拖进去,修改identifier(它的代号,后面编辑的时候是它的名字),字号字体,初始文本。也可以都不用改。

slider也是一样,拖进去,改参数。比如最大最小值什么的。

这里有些小技巧,比如动态文本框的MAX一般为1,就是只能输入一行,输入完了按回车就可以完事。如果MAX设置2,就可以输入两行哦。如果想把滑动条设置成竖着的,只需要鼠标调整它的大小变成竖着的就行了。
GUI建好了,可以保存,关闭。后面如果还想修改上面这些东西,可以命令行敲guide,打开改。
这时候matlab的编辑区会产生这个figure的源代码。下面实现GUI的功能全靠写代码。
写代码实现功能
下面先来看看它默认生成的文件是个什么意思
function varargout = untitled1(varargin)
% UNTITLED1 MATLAB code for untitled1.fig
%      UNTITLED1, by itself, creates a new UNTITLED1 or raises the existing
%      singleton*.
%
%      H = UNTITLED1 returns the handle to a new UNTITLED1 or the handle to
%      the existing singleton*.
%
%      UNTITLED1('CALLBACK',hObject,eventData,handles,...) calls the local
%      function named CALLBACK in UNTITLED1.M with the given input arguments.
%
%      UNTITLED1('Property','Value',...) creates a new UNTITLED1 or raises the
%      existing singleton*.  Starting from the left, property value pairs are
%      applied to the GUI before untitled1_OpeningFcn gets called.  An
%      unrecognized property name or invalid value makes property application
%      stop.  All inputs are passed to untitled1_OpeningFcn via varargin.
%
%      *See GUI Options on GUIDE's Tools menu.  Choose "GUI allows only one
%      instance to run (singleton)".
%
% See also: GUIDE, GUIDATA, GUIHANDLES

% Edit the above text to modify the response to help untitled1

% Last Modified by GUIDE v2.5 09-May-2020 21:22:10

% Begin initialization code - DO NOT EDIT
gui_Singleton = 1;
gui_State = struct('gui_Name',       mfilename, ...
                   'gui_Singleton',  gui_Singleton, ...
                   'gui_OpeningFcn', @untitled1_OpeningFcn, ...
                   'gui_OutputFcn',  @untitled1_OutputFcn, ...
                   'gui_LayoutFcn',  [] , ...
                   'gui_Callback',   []);
if nargin && ischar(varargin{
     1})
    gui_State.gui_Callback = str2func(varargin{
     1});
end

if nargout
    [varargout{
     1:nargout}] = gui_mainfcn(gui_State, varargin{
     :});
else
    gui_mainfcn(gui_State, varargin{
     :});
end
% End initialization code - DO NOT EDIT


% --- Executes just before untitled1 is made visible.
function untitled1_OpeningFcn(hObject, eventdata, handles, varargin)
% This function has no output args, see OutputFcn.
% hObject    handle to figure
% eventdata  reserved - to be defined in a future version of MATLAB
% handles    structure with handles and user data (see GUIDATA)
% varargin   command line arguments to untitled1 (see VARARGIN)

% Choose default command line output for untitled1
handles.output = hObject;

% Update handles structure
guidata(hObject, handles);

% UIWAIT makes untitled1 wait for user response (see UIRESUME)
% uiwait(handles.figure1);


% --- Outputs from this function are returned to the command line.
function varargout = untitled1_OutputFcn(hObject, eventdata, handles)
% varargout  cell array for returning output args (see VARARGOUT);
% hObject    handle to figure
% eventdata  reserved - to be defined in a future version of MATLAB
% handles    structure with handles and user data (see GUIDATA)

% Get default command line output from handles structure
varargout{
     1} = handles.output;


function edit1_Callback(hObject, eventdata, handles)
% hObject    handle to edit1 (see GCBO)
% eventdata  reserved - to be defined in a future version of MATLAB
% handles    structure with handles and user data (see GUIDATA)

% Hints: get(hObject,'String') returns contents of edit1 as text
%        str2double(get(hObject,'String')) returns contents of edit1 as a double


% --- Executes during object creation, after setting all properties.
function edit1_CreateFcn(hObject, eventdata, handles)
% hObject    handle to edit1 (see GCBO)
% eventdata  reserved - to be defined in a future version of MATLAB
% handles    empty - handles not created until after all CreateFcns called

% Hint: edit controls usually have a white background on Windows.
%       See ISPC and COMPUTER.
if ispc && isequal(get(hObject,'BackgroundColor'), get(0,'defaultUicontrolBackgroundColor'))
    set(hObject,'BackgroundColor','white');
end


% --- Executes on slider movement.
function slider1_Callback(hObject, eventdata, handles)
% hObject    handle to slider1 (see GCBO)
% eventdata  reserved - to be defined in a future version of MATLAB
% handles    structure with handles and user data (see GUIDATA)

% Hints: get(hObject,'Value') returns position of slider
%        get(hObject,'Min') and get(hObject,'Max') to determine range of slider


% --- Executes during object creation, after setting all properties.
function slider1_CreateFcn(hObject, eventdata, handles)
% hObject    handle to slider1 (see GCBO)
% eventdata  reserved - to be defined in a future version of MATLAB
% handles    empty - handles not created until after all CreateFcns called

% Hint: slider controls usually have a light gray background.
if isequal(get(hObject,'BackgroundColor'), get(0,'defaultUicontrolBackgroundColor'))
    set(hObject,'BackgroundColor',[.9 .9 .9]);
end
反正就是大段的注释,看看就好。可以写代码加入自己想要的功能。
-
第一个function是untitiled1,是文件的一些初始设置。里面都不用管。第二个类似,也不用管。
-
第三个是OutputFcn,里面本来的代码不用动,把我们想写的初始代码写这。比如窗口一打开,就画个初始的图y=ax,a先取1。
-
edit1_Callback函数
这个是动态文本框的响应函数,就是你在窗口中操作动态文本框,它就会运行下面的程序。如果你的动态文本框给的identifier名字是edit2,那这个函数名也与之对应。有两句常用的代码。注意如果这两句代码用在edit1_Callback函数下,可以用hObject获取句柄。如果想在别的function中这些代码改变edit1的文本,则需要用handles.edit1获取句柄。
    editdata = get(hObject,'String');   %得到输入的字符串,如果要得到数字,还需要用str2num
    set(handles.edit1,'string',‘我要输入的文本’);  %这句代码可以改变文本框中的文本。
- edit1_CreateFcn函数
是动态文本框的初始函数。GUI界面一打开,这个函数下的代码就运行一下。可以设置文本框的初值。比如我设置文本框初始显示1
set(hObject,'string',‘1’);
- slider1_Callback函数
是滑动条slider1的响应函数,记住以下两句话
     sliderdata = get(hObject,'Value');  %得到滑动条的值
     set(handles.slider1,'value',a);  % 设置滑动条的值,设置的是数值,value类型
- slider1_CreateFcn函数
是滑动条slider1的初始函数。GUI刚打开的时候运行下面这个,可以设置滑动条初始位置。比如设置为1
set(hObject,'Value',1);
也可以根据自己的需要新写一些function,方便引用
为了实现文初提到的功能–文本框和滑动条同时可以调节a值,并实时绘图y=ax。可以在edit1
的响应函数下写
global a;
    global x;
    input = str2num(get(hObject,'String'));
    if input<=10
        a = input;
        y = a*x;
        plot(x,y);
        ylim([0,100]);
        set(handles.slider1,'Value',a); %使得滑动条和输入框保持一致
    else
        msgbox('invalid value','warning','warn'); %error message window
    end
注意同一全局变量在所有被用到的地方都应该先申明global,不然就当局部变量处理了。
同理,slider1的响应函数可以写入:
global a;
    global x;
    input = get(hObject,'Value');
    a = input;
    y = a*x;
    plot(x,y);
    ylim([0,100]);
    set(handles.edit1,'String',num2str(a)); %使得输入框edit1和滑动条保持一致
打开GUI的初始程序untitled1_OutputFcn可以如下(直接加在对应function里面):
global a ;
global x ;
a=1;
x = 0:10;
y = a*x;
plot(x,y);
ylim([0,100]);

% Get default command line output from handles structure
varargout{
     1} = handles.output;
这样就可以啦!
如文初,点击运行程序,可以跳出想要的GUI,调节a值,曲线图也变化。
如果调的过程中有bug,可以评论让大家都知道。
这里用到的代码可以在我的资源里下载。如下
https://download.csdn.net/download/benchuspx/12404653
