Pandas库的基础入门(二)
!承接上文:Pandas库的基础入门(一)
前文链接
Pandas库的基础入门(一)
四、Pandas入门常用
基于Pandas的缺失值处理方法
- 重建索引,重构数据帧
#读入大车的单车源强数据
df = pd.read_excel('C:/Users/13109/desktop/单车源强数据2.xlsx','大车',na_vlues=['NA'])
# #重建横坐标索引
df.index = (range(1,len(df)+1))
# # 根据索引重新构建数据
df1 = df.reindex(index=(range(400,405)),columns=list(df.columns)+['声压级(mean)'])
df1['声压级(mean)'] = (df1['Sound_pressure_level_1 ']+df['Sound_pressure_level_1 '])/2
df1 = df1.iloc[:,[0,5,6,7]]#选取后续试验数据列
print(df1)

#打印输出结果
(noise_data) D:\CloudMusic\virtualenv\noise_data\traffic_noise>python test.py
      id  Radar_speed   Number_of_axes  声压级(mean)
400  400            48             3.0       88.3
401  401            79             NaN       90.7
402  402            71             NaN       89.4
403  403            45             NaN       87.7
404  404            53             NaN       87.3
- 删除,填充缺失值
# 表示删除任何带有缺失值的行
print(df1.dropna(how='any'))
# 表示删除全为空值的行
print(df1.dropna(how='all'))

# #填充缺失值部分
print(df1.fillna(value=5))

#表示删除列,任何带有缺失值的行
print(df1.dropna(axis=1,how='any'))

# 传入thresh=n保留至少有n个非NaN数据的行
print(df1.dropna(thresh=4))

#打印输出结果如下
      id  Radar_speed   Number_of_axes  声压级(mean)
400  400            48             3.0       88.3
      id  Radar_speed   Number_of_axes  声压级(mean)
400  400            48             3.0       88.3
401  401            79             NaN       90.7
402  402            71             NaN       89.4
403  403            45             NaN       87.7
404  404            53             NaN       87.3
      id  Radar_speed   Number_of_axes  声压级(mean)
400  400            48             3.0       88.3
401  401            79             5.0       90.7
402  402            71             5.0       89.4
403  403            45             5.0       87.7
404  404            53             5.0       87.3
      id  Radar_speed   声压级(mean)
400  400            48       88.3
401  401            79       90.7
402  402            71       89.4
403  403            45       87.7
404  404            53       87.3
      id  Radar_speed   Number_of_axes  声压级(mean)
400  400            48             3.0       88.3
- 常用统计函数(调用方法会自动排除缺失值)
#统计数据帧列均值
print(df1.mean())

#统计数据帧行均值
print(df1.mean(1))
# 随机生成0-7的10个数,并且统计每个数字的出现频率
s = pd.Series(np.random.randint(0,7,size=10))
print(s)
print(s.value_counts())

#打印输出
id                402.00
Radar_speed        59.20
Number_of_axes      3.00
声压级(mean)          88.68
dtype: float64
400    134.825000
401    190.233333
402    187.466667
403    178.566667
404    181.433333
dtype: float64

0    5
1    0
2    4
3    0
4    6
5    2
6    1
7    5
8    4
9    2
dtype: int32
5    2
4    2
2    2
0    2
6    1
1    1
dtype: int64
合并,追加相关,concat,merge,append
#使用 concat()连接Pandas对象:

df2 = pd.DataFrame(np.random.randn(10,4))

pieces = [df2[:3],df2[3:7]]

print(pd.concat(pieces))

# 打印输出
          0         1         2         3
0  0.479241  0.893495 -0.693154 -0.852424
1  0.026010 -0.545286 -0.770675 -0.878548
2 -0.202394  0.578639  0.881338  0.395578
3  0.325128  0.548995 -0.101962 -0.461443
4 -0.802353 -0.299208 -0.348705  0.679093
5 -0.249706 -0.886568  1.233265  0.436658
6  1.453547  1.510276 -1.610860 -0.551154

#SQL风格的合并对象

left = pd.DataFrame({
     'key': ['foo', 'bar'], 'lval': [1, 2]})
right = pd.DataFrame({
     'key': ['foo', 'bar'], 'rval': [4, 5]})
print(pd.merge(left, right))

#打印输出
   key  lval  rval
0  foo     1     4
1  bar     2     5

#追加append,在原有数据帧上面追加一行
df1 = pd.DataFrame(np.random.randn(4,4),columns=['a','b','c','d'])
# print(df1)
s = df1.iloc[3,:]
print(s)
print(df1.append(s,ignore_index=True))

#打印输出
a   -0.921758
b    1.279065
c    0.586039
d   -1.163983
Name: 3, dtype: float64
          a         b         c         d
0 -2.128083  1.791574 -0.689094 -1.149643
1 -1.355857  0.953556  0.617027 -1.586289
2  0.047451 -1.135767 -2.232663 -0.094852
3 -0.921758  1.279065  0.586039 -1.163983
4 -0.921758  1.279065  0.586039 -1.163983
分组(Grouping),数据分组后的处理
'''
我们所说的“group by“是指涉及下列一项或多项步骤的程序:

Splitting:根据一些标准将数据分解成组
Applying:将函数独立地应用于每个组
Combining:将结果组合成数据结构
'''
df1 = pd.DataFrame({
      'A' : ['foo', 'bar', 'foo', 'bar',
                         'foo', 'bar', 'foo', 'foo'],
                    'B' : ['one', 'one', 'two', 'three',
                           'two', 'two', 'one', 'three'],
                    'C' : np.random.randn(8),
                    'D' : np.random.randn(8)})
# 按照A列标签分组,然后将mean()函数应用于C,D数据列分组结果:
print(df1.groupby('A').mean())
#多列分组形成层次索引
print(df1.groupby(['A','B']).sum())

#打印输出
            C         D
A
bar -0.259116  1.004532
foo  0.198292  0.002419
                  C         D
A   B
bar one    0.870513  1.548039
    three -0.577857  0.560252
    two   -1.070003  0.905304
foo one    0.056086  0.216536
    three  0.967545  0.636640
    two   -0.032170 -0.841082
数据透视表,时间序列数据帧生成
#根据数据帧生成相应的数据透视表
df1 = pd.DataFrame({
     'A' : ['one', 'one', 'two', 'three'] * 3,
                   'B' : ['A', 'B', 'C'] * 4,
                   'C' : ['foo', 'foo', 'foo', 'bar', 'bar', 'bar'] * 2,
                   'D' : np.random.randn(12),
                   'E' : np.random.randn(12)})

print(df1)
s = pd.pivot_table(df1,values='D',index=['A','B'],columns='C')
print(s)
分类(Categoricals)
- 改换数据类型(category数据类型)
df = df.iloc[100:200,4:7]
# 将轴数列转换为category数据类型:
df['cat'] = df['Number_of_axes'].astype('category')
print(df.cat)

#打印输出
(noise_data) D:\CloudMusic\virtualenv\noise_data\traffic_noise>python test.py
100    3.0
101    4.0
102    4.0
103    4.0
104    3.0
      ...
195    2.0
196    6.0
197    4.0
198    3.0
199    3.0
Name: cat, Length: 100, dtype: category
Categories (5, float64): [2.0, 3.0, 4.0, 5.0, 6.0]
- 类别重命名(Series.cat.categories属性分配新值或使用以下 rename_categories()方法)
#选取样本数据,主要是用轴数作为分类标签
df = df.iloc[100:200,4:7]
df=df[df.Number_of_axes.notnull()]#布尔索引,找出所有轴数不为空的行
# df = df.dropna(how='any')#布尔索引,删除任何为空值的行
# 将轴数列转换为category数据类型:
df['cat'] = df['Number_of_axes'].astype('category')


#类别重命名
df['cat'].cat.categories = ['轴1','轴2','轴3','轴4','轴5']
df['cat'].cat.categories = ['%s'%g for g in df['cat'].cat.categories]#与上述写法一样
# df['cat'] = df['cat'].cat.rename_categories([1,2,3,4,5]) #另外一种重命名方法

#追加新类别

df['cat']=df['cat'].cat.add_categories(['新增轴'])
print(df['cat'])

#打印输出
100    轴2
101    轴3
102    轴3
103    轴3
104    轴2
       ..
195    轴1
196    轴5
197    轴3
198    轴2
199    轴2
Name: cat, Length: 99, dtype: category
Categories (5, object): [轴1, 轴2, 轴3, 轴4, 轴5]
     Rear_speed  Radar_speed   Number_of_axes cat
100        81.2            84             3.0  轴2
101        35.3            54             4.0  轴3
102        57.8            61             4.0  轴3
103        86.7            90             4.0  轴3
104        72.3            73             3.0  轴2
..          ...           ...             ...  ..
195        40.4            43             2.0  轴1
196        68.7            71             6.0  轴5
197        44.7            47             4.0  轴3
198        62.2            65             3.0  轴2
199        52.4            55             3.0  轴2

[99 rows x 4 columns]
- 追加,删除,设定一个新的类别
#追加新类别

df['cat']=df['cat'].cat.add_categories(['新增轴'])
print(df['cat'])

#删除一个类别

df['cat']=df['cat'].cat.remove_categories(['新增轴'])#删除固定类别
df['cat']=df['cat'].cat.remove_unused_categories()#删除未使用的类别
print(df['cat'])

#设定一个类别,categories重新排序并同时添加缺少的category
df['cat'] = df['cat'].cat.set_categories(['轴1','轴2','轴3','轴4','轴5'])
print(df.sort_values(by='cat',ascending=False))#降序排序
print(df.groupby('cat').size())#按分好类的列分组(groupby),统计出想用类别的样本数据量

# 打印输出
(noise_data) D:\CloudMusic\virtualenv\noise_data\traffic_noise>python test.py
100    轴2
101    轴3
102    轴3
103    轴3
104    轴2
       ..
195    轴1
196    轴5
197    轴3
198    轴2
199    轴2
Name: cat, Length: 99, dtype: category
Categories (6, object): [轴1, 轴2, 轴3, 轴4, 轴5, 新增轴]
100    轴2
101    轴3
102    轴3
103    轴3
104    轴2
       ..
195    轴1
196    轴5
197    轴3
198    轴2
199    轴2
Name: cat, Length: 99, dtype: category
Categories (5, object): [轴1, 轴2, 轴3, 轴4, 轴5]
     Rear_speed  Radar_speed   Number_of_axes cat
133        57.4            60             6.0  轴5
155        55.6            57             6.0  轴5
176        76.1            79             6.0  轴5
196        68.7            71             6.0  轴5
109        92.0            97             6.0  轴5
..          ...           ...             ...  ..
139        58.3            61             2.0  轴1
151        45.7            64             2.0  轴1
128        80.1            93             2.0  轴1
137        50.8            56             2.0  轴1
157        66.5            69             2.0  轴1

[99 rows x 4 columns]
cat
轴1    16
轴2    27
轴3    38
轴4     7
轴5    11
dtype: int64
可视化部分需要重点研究,后续会写matplotlib相关的文章
绘图(pandas与matplotlib 联合使用)
- 简单的折线图
import xlrd
import numpy as np
import pandas as pd
# print(pd.__version__)
import matplotlib.pyplot as plt
# 这两句代码用来正确显示图中的中文字体,后续都要加上
plt.rcParams['font.sans-serif']=['SimHei'] #用来正常显示中文标签
plt.rcParams['axes.unicode_minus']=False #用来正常显示负号

#读入大车的单车源强数据
df = pd.read_excel('C:/Users/13109/desktop/单车源强数据2.xlsx','大车',na_vlues=['NA'])
'''
绘图相关内容

'''
#索引出实验样本
df = df.iloc[:,2:6]
df = df.dropna(how='any')#删除任何带有空值的行
x = df['Rear_speed']
y = df['Soundlevel_2']
'''
绘制折线图,在DataFrame上,plot()可以方便地使用标签绘制所有列
'''
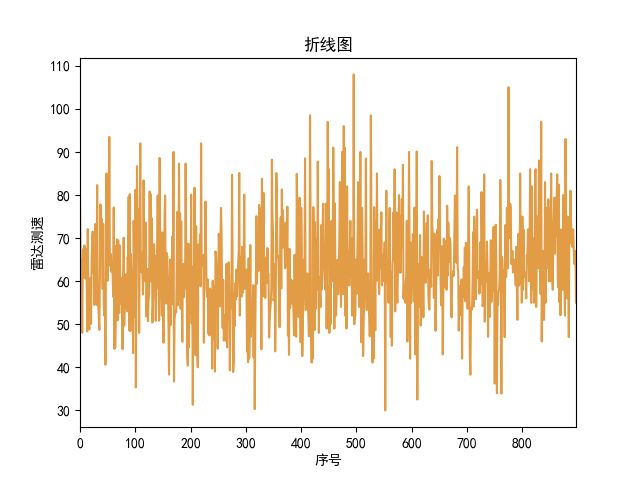
x.plot(color='#e29c45')
plt.title('折线图')
plt.xlabel('序号')
plt.ylabel('雷达测速')
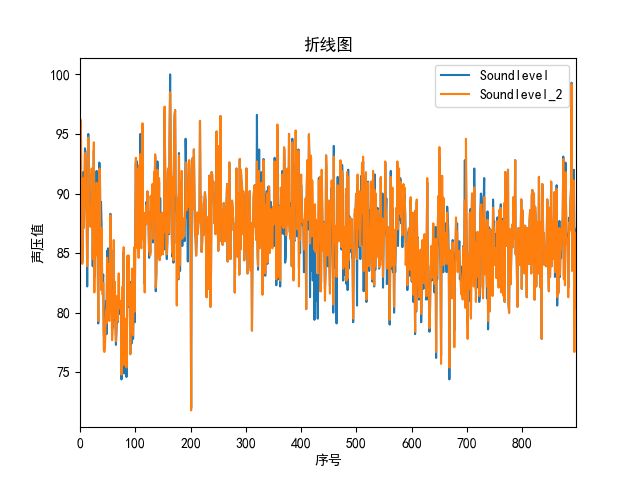
df1 = df.iloc[:,0:2]
df1.plot()
# df.plot(color='#e29c45')
plt.title('折线图')
plt.xlabel('序号')
plt.ylabel('声压值')
plt.show()
plt.close('all')
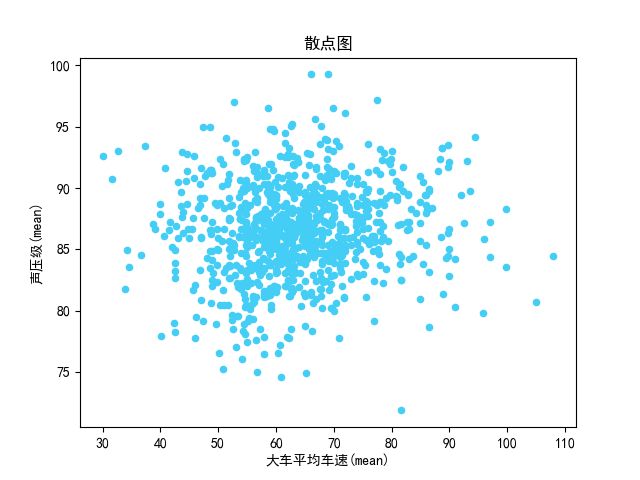
- 简单的散点图(使用以下x和y关键字 绘制一列与另一列的关系)
df['声压级(mean)'] = (df['Soundlevel ']+df['Soundlevel_2'])/2
df['大车平均车速(mean)'] = (df['Rear_speed']+df['Radar_speed '])/2
df.plot.scatter(y='声压级(mean)',x='大车平均车速(mean)',color='#44cef6')
# print(df.columns),print(df)
# plt.legend()
plt.title('散点图')
plt.show()
plt.close('all')
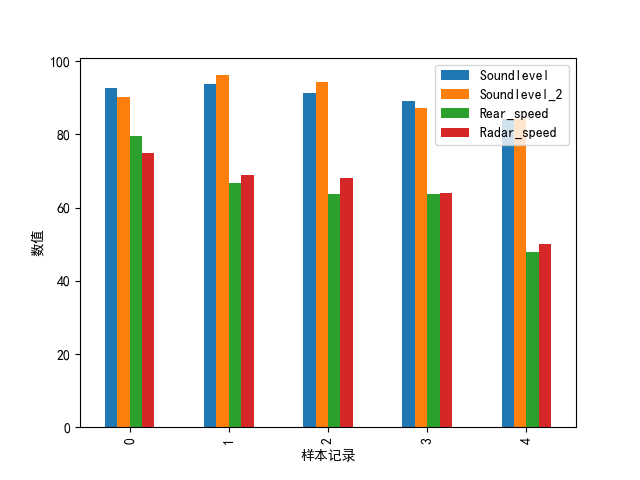
- 各种简单的条形图
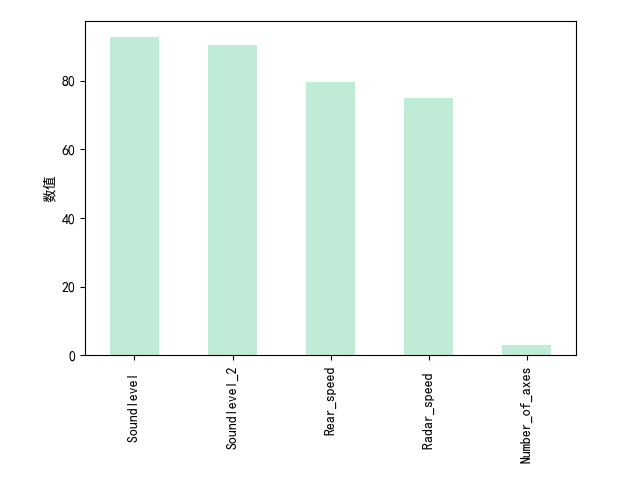
#选取一行数据,列标签作为x轴标签的单一条形图
df.iloc[0].plot(kind='bar',color='#e29c45')
plt.ylabel('数值')
plt.show()
#选取多行数据,调用DataFrame的plot.bar()方法会产生一个多条形图:
df.iloc[0:5,0:4].plot(kind='bar')
df.iloc[0:5,0:4].plot.bar()#两种方法都可以实现绘制条形图
plt.ylabel('数值')
plt.xlabel('样本记录')
plt.show()
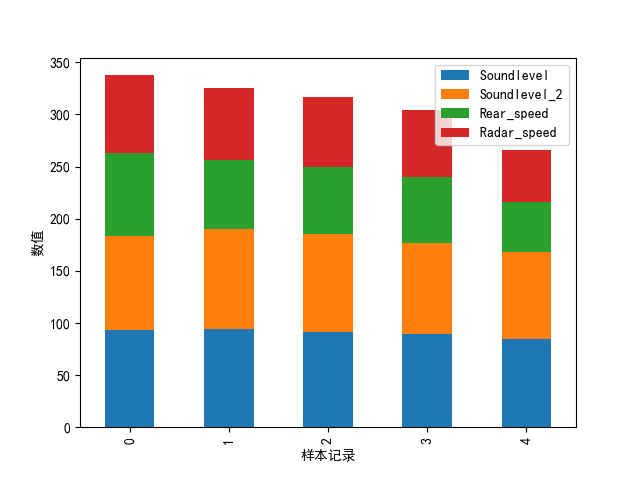
#选取多行数据,plot.bar()生成堆积条形图
# df.iloc[0:5,0:4].plot(kind='bar')
df.iloc[0:5,0:4].plot.bar(stacked=True)
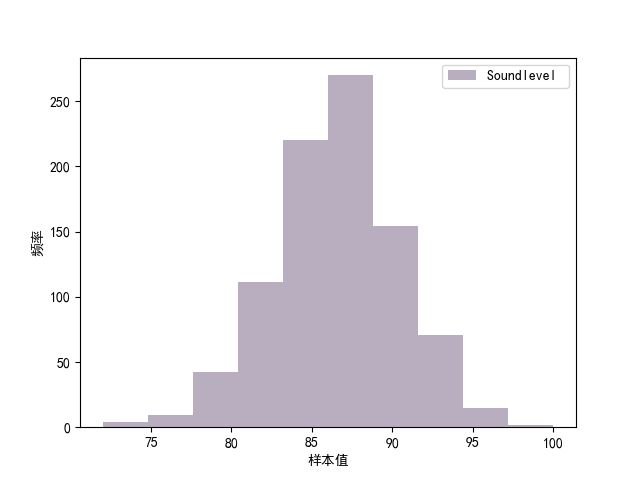
- 简单的直方图
#选取声压级1对应的数据作为样本(效果好)
df = df.iloc[:,2]
df = df.dropna(how='any')#删除任何带有空值的行
print(df)
df.plot.hist(alpha=0.5,color='#725e82')
plt.ylabel('频率')
plt.xlabel('样本值')
plt.legend(loc='best')
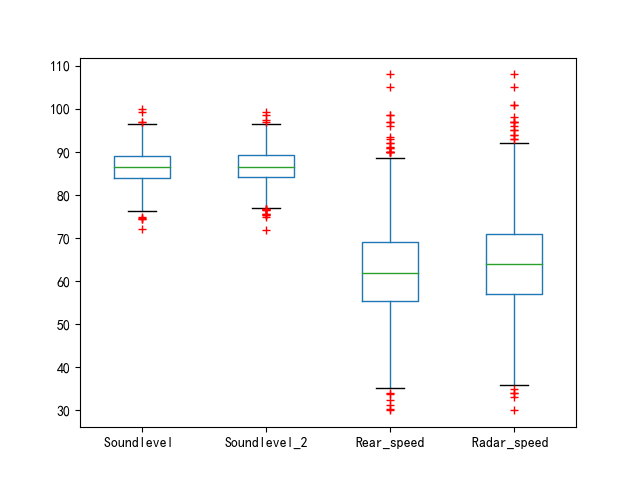
- 箱线图绘制
#箱线图,是一种用作显示一组数据分散情况资料的统计图,箱形图最大的优点就是不受异常值的影响,能够准确稳定地描绘出数据的离散分布情况,同时也利于数据的清洗。
df = df.iloc[:,2:6]
df = df.dropna(how='any')#删除任何带有空值的行
print(df)
df.plot.box(sym='r+')
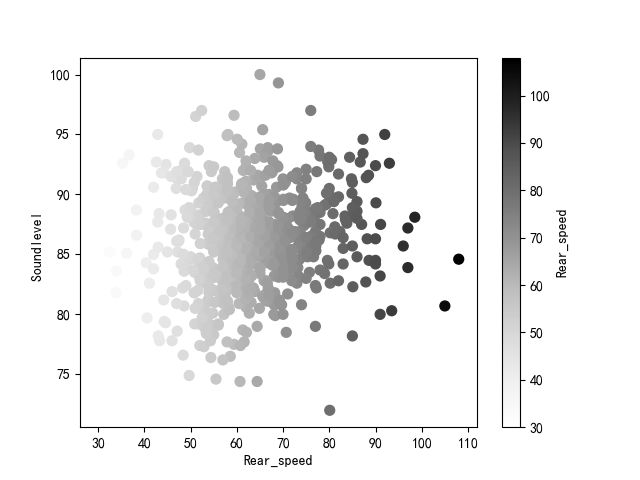
- 热力图绘制
#关键字c可以作为列的名称给出,以便为每个点提供颜色
df.plot.scatter(x='Rear_speed', y='Soundlevel ',c ='Rear_speed', s=50)
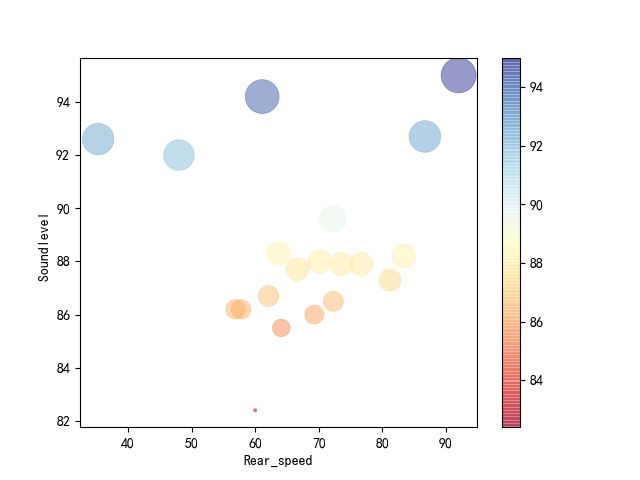
- 气泡热力图绘制
'''
气泡图主要是用来直观的感受数据点的大小,还有比较美观
'''
df = df.iloc[100:120,2:7]
df = df.dropna(how='any')#删除任何带有空值的行
z=df['Soundlevel ']#调整点大小的数据
cm = plt.cm.get_cmap('RdYlBu')#获取各个点的颜色数据
# print(cm)
df.plot.scatter(x='Rear_speed', y='Soundlevel ',s=(z - np.min(z) + 0.1)*50,c = z, cmap = cm, linewidth = 0.5, alpha = 0.5)
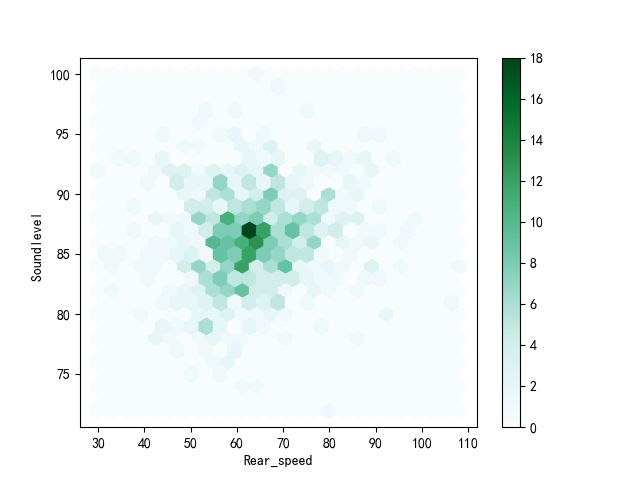
- 六边形分级图
'''
六边形分级图可以主观的感受数据点分布状况,数据太密集而无法单独绘制每个点,则Hexbin图可能是散点图的有用替代方法,可以给出散点分布的直方图效果,也就是直观的观察出数据点的集中位置
'''
df.plot.scatter(x='Rear_speed', y='Soundlevel ')#原始的散点图绘制
df.plot.hexbin(x='Rear_speed', y='Soundlevel ', gridsize=25)#六边形分级图绘制
plt.show()
两张图片的对比如下:
!基于pandas的matplotlib的使用告一段落
五、总结
- 1、要重点掌握文件的导入导出以及数据帧的索引切片等内容
- 2、pandas一般用于数据清洗以及机器学习之前的数据预处理工作
- 3、基于pandas的绘图要重点研究,后续会写matplotlib的专题
参考文章内容链接
- Pandas中文网、Pandas官方中文文档
- Pandas官方英文文档
- Panda 0.25.0文档
- Pandas可视化-气泡图
