Matlab 画图(1)
如何把matlab画图窗口的背景颜色设置为白色?
set(0,'defaultfigurecolor','w')
Fig1.摩擦系数变化曲线
x=0:0.2:1;
y=[
  0 0 0 0;
  0.58 0.31 0.18 0.08;
  0.83 0.56 0.36 0.19;
  1.14 0.89 0.62 0.30;
  1.56,1.23 0.78 0.36;
  2.08 1.52 0.99 0.49;
  ]
plot(x,y);
x = linspace(0,2*pi,100);
y1 = sin(x);
y2 = sin(x+pi/4);
y3 = sin(x-pi/4);
plot(x,y1,x,y2,x,y3);
clear;clc;clf;
x1=linspace(0,2*pi,100);
x2=x1-pi/4;
y1=sin(x1);
y2=5*cos(x2);
plot(x1,y1,x2,y2);
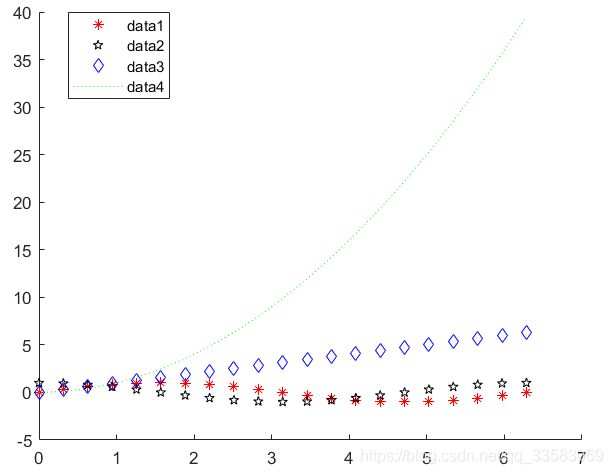
x=0:pi/10:2*pi;
y1=sin(x);
y2=cos(x);
y3=x;
y4=x.^2;
hold on;
plot(x,y1,'r*');
plot(x,y2,'kp');
plot(x,y3,'bd');
plot(x,y4,'g:');
hold off;
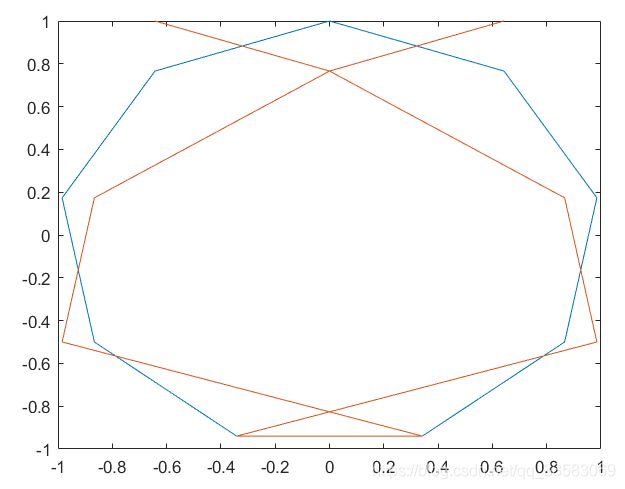
N = 9;
t = 0:2*pi/N:2*pi;
x = sin(t);y = cos(t);
tt = reshape(t,2,(N+1)/2);
tt = flipud(tt);
tt = tt(:);
xx=sin(tt);yy=cos(tt);
plot(x,y);
hold on;
plot(xx,y);
hold off;
plot(xx,y);
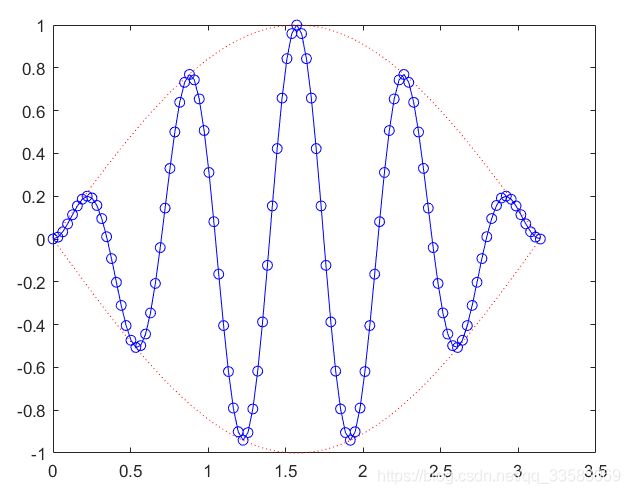
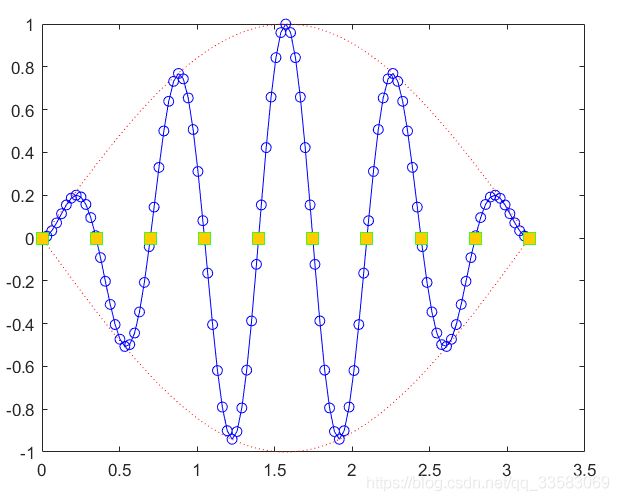
t = (0:pi/100:pi)';
y1 = sin(t)*[1,-1];
y2 = sin(t).*sin(9*t);
t3 = pi*(0:9)/9;
plot(t,y1,'r:',t,y2,'-bo');
hold on;
hold on;
y3 = sin(t3).*sin(9*t3);
plot(t3,y3,'s','MarkerSize',10,'MarkerEdgeColor',[0,1,0],'MarkerFaceColor',[1,0.8,0]);
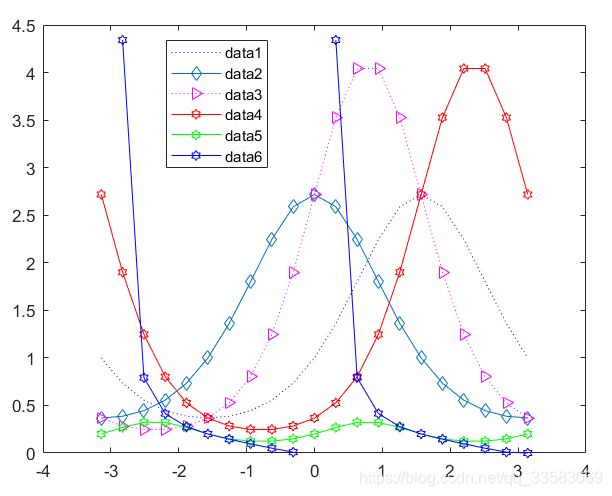
x=-pi:pi/10:pi;
y1=exp(sin(x));
y2=exp(cos(x));
y3=exp(sin(x)+cos(x));
y4=exp(sin(x)-cos(x));
y5=0.2*exp(sin(x).*cos(x));
y6=0.2*exp(sin(x).\cos(x));
plot(x,y1,'b:',x,y2,'d-',x,y3,'m>:',x,y4,'rh-',x,y5,'gh-',x,y6,'bh-');


