matplotlib: pyplot.legend
参考:官网
在轴上画一个图示(legend)
比如:
fig, ax = plt.subplots()
ax.plot([1,2,3])
ax.legend(['A simple Line'])
plt.show()
为了让标签和所画图的联系更明确,更好的做法是在画图的时候就设置标签
line, = ax.plot([1, 2, 3], label=’Inline label’)
或者通过set_label重载(重写)标签,然后legend()放置图示
line.set_label(‘Label via method’)
ax.legend()
通过下面的方式给出标签
legend((line1, line2, line3), (‘label1’, ‘label2’, ‘label3’))
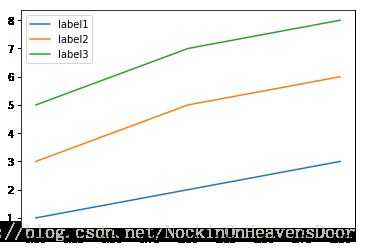
例子:
fig, ax = plt.subplots()
line1, = ax.plot([1, 2, 3])
line2, = ax.plot([3, 5, 6])
line3, = ax.plot([5, 7, 8])
plt.legend((line1, line2, line3), ('label1', 'label2', 'label3'))
plt.show()
参数:
loc : 图示放在什么位置,默认:‘upper right’
可选参数:
‘best’ 0
‘upper right’ 1
‘upper left’ 2
‘lower left’ 3
‘lower right’ 4
‘right’ 5
‘center left’ 6
‘center right’ 7
‘lower center’ 8
‘upper center’ 9
‘center’ 10
bbox_to_anchor : 声明放置图示的任意位置。默认轴坐标
For example, to put the legend’s upper right hand corner in the center of the axes the following keywords can be used:
例如,在轴的中心的右上角放置图示
loc=’upper right’, bbox_to_anchor=(0.5, 0.5)
其他的留着以后用到在说把
ncol : integer
The number of columns that the legend has. Default is 1.
prop : None or matplotlib.font_manager.FontProperties or dict
The font properties of the legend. If None (default), the current matplotlib.rcParams will be used.
fontsize : int or float or {‘xx-small’, ‘x-small’, ‘small’, ‘medium’, ‘large’, ‘x-large’, ‘xx-large’}
Controls the font size of the legend. If the value is numeric the size will be the absolute font size in points. String values are relative to the current default font size. This argument is only used if prop is not specified.
numpoints : None or int
The number of marker points in the legend when creating a legend entry for a line/matplotlib.lines.Line2D. Default is None which will take the value from the legend.numpoints rcParam.
scatterpoints : None or int
The number of marker points in the legend when creating a legend entry for a scatter plot/ matplotlib.collections.PathCollection. Default is None which will take the value from the legend.scatterpoints rcParam.
scatteryoffsets : iterable of floats
The vertical offset (relative to the font size) for the markers created for a scatter plot legend entry. 0.0 is at the base the legend text, and 1.0 is at the top. To draw all markers at the same height, set to [0.5]. Default [0.375, 0.5, 0.3125].
markerscale : None or int or float
The relative size of legend markers compared with the originally drawn ones. Default is None which will take the value from the legend.markerscale rcParam.
markerfirst : bool
if True, legend marker is placed to the left of the legend label if False, legend marker is placed to the right of the legend label
frameon : None or bool
Control whether the legend should be drawn on a patch (frame). Default is None which will take the value from the legend.frameon rcParam.
fancybox : None or bool
Control whether round edges should be enabled around the FancyBboxPatch which makes up the legend’s background. Default is None which will take the value from the legend.fancybox rcParam.
shadow : None or bool
Control whether to draw a shadow behind the legend. Default is None which will take the value from the legend.shadow rcParam.
framealpha : None or float
Control the alpha transparency of the legend’s background. Default is None which will take the value from the legend.framealpha rcParam.
facecolor : None or “inherit” or a color spec
Control the legend’s background color. Default is None which will take the value from the legend.facecolor rcParam. If “inherit”, it will take the axes.facecolor rcParam.
edgecolor : None or “inherit” or a color spec
Control the legend’s background patch edge color. Default is None which will take the value from the legend.edgecolor rcParam. If “inherit”, it will take the axes.edgecolor rcParam.
mode : {“expand”, None}
If mode is set to “expand” the legend will be horizontally expanded to fill the axes area (or bbox_to_anchor if defines the legend’s size).
bbox_transform : None or matplotlib.transforms.Transform
The transform for the bounding box (bbox_to_anchor). For a value of None (default) the Axes’ transAxes transform will be used.
title : str or None
The legend’s title. Default is no title (None).
borderpad : float or None
The fractional whitespace inside the legend border. Measured in font-size units. Default is None which will take the value from the legend.borderpad rcParam.
labelspacing : float or None
The vertical space between the legend entries. Measured in font-size units. Default is None which will take the value from the legend.labelspacing rcParam.
handlelength : float or None
The length of the legend handles. Measured in font-size units. Default is None which will take the value from the legend.handlelength rcParam.
handletextpad : float or None
The pad between the legend handle and text. Measured in font-size units. Default is None which will take the value from the legend.handletextpad rcParam.
borderaxespad : float or None
The pad between the axes and legend border. Measured in font-size units. Default is None which will take the value from the legend.borderaxespad rcParam.
columnspacing : float or None
The spacing between columns. Measured in font-size units. Default is None which will take the value from the legend.columnspacing rcParam.
handler_map : dict or None
The custom dictionary mapping instances or types to a legend handler. This handler_map updates the default handler map found at matplotlib.legend.Legend.get_legend_handler_map().

