vue中使用Echarts自定义折线图+粒度选项+自定义legend

大家好, 今天所分享的案例是在vue中使用echarts自定义折线图(复杂点是通过点击勾选单个选项卡显示对应的折线图,通过切换粒度,可以拆分为日粒度,周粒度,月粒度,x轴时间轴也做对应的变化 )
本案例主要涉及到
- 通过日期选择器选择对应的时间段
- 通过选项卡点击单选显示对应的x轴
- 通过粒度 可以切换不同的x轴
- 自定义legend
- 点击重置 重置选项卡以及图表
- 实现双y轴(一般数值和百分比轴)
- 本案例是一个完成的图表功能(附带代码)
第一步使用echarts图表
安装依赖
npm install echarts --save在main.js文件中引入
import echarts from 'echarts'
在当前需要使用到Echarts图表的组件中
在mounted这个生命周期钩子中初始化实例 通过ref引用main结构,并把当前图表的数据列表及配置项添加到图表中
使用Echarts的 setOption方法
 mounted() {
    this.getCharts();

    //  echarts的初始化进入页面 渲染图表
    this.oderFormChart = this.$echarts.init(this.$refs.main);

    this.oderFormChart.setOption(this.oderFormOption, true);

    // 自适应 使图表宽度自适应页面宽度
    window.onresize = () => {
      this.oderFormChart.resize();

    };
  },
this.oderFormChart.setOption(this.oderFormOption, true);当前 我还没有跟大家具体描述Echarts的配置项(this.oderFormOption)
先给大家贴上配置项的代码
data() {
return{
oderFormOption: {
title: {
text: "商品分析图",
},
tooltip: {
trigger: "axis",
},
grid: {
left: "3%",
right: "4%",
bottom: "3%",
containLabel: true,
},
toolbox: {
feature: {
saveAsImage: {},
},
},
xAxis: {
type: "category",
splitLine: { show: false },
data: [],
axisLabel: {
interval: 10,
},
boundaryGap: false,
},
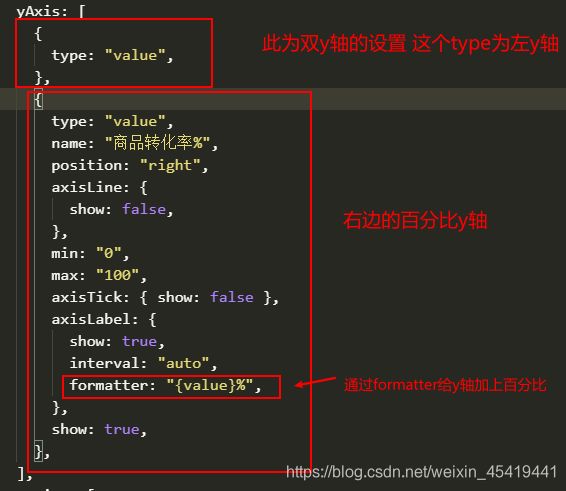
yAxis: [
{
type: "value",
},
{
type: "value",
name: "商品转化率%",
position: "right",
axisLine: {
show: false,
},
min: "0",
max: "100",
axisTick: { show: false },
axisLabel: {
show: true,
interval: "auto",
formatter: "{value}%",
},
show: true,
},
],
series: [
{
name: "商品访问数",
type: "line",
smooth: true,
color: ["#175EDE"],
data: [],
},
{
name: "商品成功支付数",
type: "line",
smooth: true,
color: ["#F3D024"],
data: [],
},
{
name: "商品成功支付金额",
type: "line",
smooth: true,
color: ["#19B955"],
data: [],
},
{
name: "商品成功支付积分",
type: "line",
smooth: true,
color: ["#FF6C6A"],
data: [],
},
{
name: "商品转化率(%)",
type: "line",
yAxisIndex: 1,
color: ["#85D4D3"],
smooth: true,
data: [],
},
],
},
}
}xAxis,yAxis 这两个配置项 分别是对x轴和y轴进行处理
 axisLabel: {
            interval: 10,
          },
interval指的是x轴的粒度的间距


以上为图表的基本配置
下边 列一下 对element日期选择器(快捷版)基本配置

data(){
return{
     // 设置时间选择器的 选项
      pickerOptions: {
        shortcuts: [
          {
            text: "最近一天",
            onClick(picker) {
              const end = new Date();
              const start = new Date();
              start.setTime(start.getTime() - 3600 * 1000 * 24 * 1);
              picker.$emit("pick", [start, end]);
            },
          },
          {
            text: "最近七天",
            onClick(picker) {
              const end = new Date();
              const start = new Date();
              start.setTime(start.getTime() - 3600 * 1000 * 24 * 7);
              picker.$emit("pick", [start, end]);
            },
          },
          {
            text: "最近三十天",
            onClick(picker) {
              const end = new Date();
              const start = new Date();
              start.setTime(start.getTime() - 3600 * 1000 * 24 * 30);
              picker.$emit("pick", [start, end]);
            },
          },
        ],
        disabledDate(time) {
          return time.getTime() > Date.now() - 8.64e6; //如果没有后面的-8.64e6就是不可以选择今天的
        },
      },

}
}
快捷设置 日期选择器 设置三天七天三十天的时间段
disabledDate(time) {
          return time.getTime() > Date.now() - 8.64e6; //如果没有后面的-8.64e6就是不可以选择今天的
        },
disabledDate来设置日期选择器的 禁止选择当前时间点之后的时间
下边开始写当进入页面时候首先获取到图表的数据
 getorderFormData(type, value) {
      var ids = [];
      if (value) {
        var ids = [value];
      } else {
        var ids = this.options.map((item, index) => {
          return item.id;
        });
      }
            //获取到选择的时间 开始时间格式化为00:00
      this.allStartDate = moment(this.dateValue[0]).format(
        "YYYY-MM-DD 00:00:00"
      );
             //结束时间格式化为 23:59:59
      this.allEndDate = moment(this.dateValue[1]).format("YYYY-MM-DD 23:59:59");
      this.submitData = {
        mallIds: ids,
        from: this.allStartDate,
        to: this.allEndDate,
        dataType: [
          "orderCount",
          "paySuccessOrderCount",
          "amount",
          "credits",
          "goodsCount",
        ],
        particle: this.oderFormPeriod,
      };

      Vue.axios({
        method: "POST",
        serviceId: "mall",
        url: "123",
        data: this.submitData,
      })
        .then((res) => {
          if (res.success) {
            // this.orderFormLoading=false
            this.oderFormxAxis = res.result.dateString;
            this.oderFormOption.xAxis.data = this.oderFormxAxis;
                //获取到图表数据存储在变量中
            this.orderFormChartsList = res.result.data;
            //  如果是切换粒度调用的当前的请求的话走进这个逻辑

            if (type == 1) {
              if (this.getSelectNum.length == 0) {
                this.shade = false;
              }
              this.getSelectNum = Array.from(new Set(this.getSelectNum));
              // 这里获取到我点击的checkbox 存储到数组中 然后在这里循环调用把数据塞入到图表中 ,不然每次只会获取到最后一个的checkbox 只能更新最后一个图表的数据
              for (var i = 0; i < this.getSelectNum.length; i++) {
                this.checkedChange(this.getSelectNum[i], 2, true);
              }
            }

            this.amount = res.result.amount;
            this.previousAmount = res.result.previousAmount;
            this.goodsCount = res.result.goodsCount;
            this.previousGoodsCount = res.result.previousGoodsCount;
            this.successOrderCount = res.result.successOrderCount;
            this.previousSuccessOrderCount =
              res.result.previousSuccessOrderCount;
            this.credits = res.result.credits;
            this.previousCredits = res.result.previousCredits;
            this.orderCount = res.result.orderCount;
            this.previousOrderCount = res.result.previousOrderCount;
          } else {
            // this.orderFormLoading=false
            Message.error("暂无订单分析数据,请稍后重试!");
          }
        })
在created中进行调用
 watch: {
    oderFormOption: {
      handler(newVal, oldVal) {
        if (this.oderFormChart) {
          // 如何有变化 就获取最新的数据 并且渲染
          this.oderFormChart.setOption(newVal);
        } else {
          // 如何无变化 还是老数据
          this.oderFormChart.setOption(oldVal);
        }
      },
      deep: true,
    }
}
在监听器中 对数据当前图表配置数据进行监听 如有改变 同步改变图例
下边开始写一下自定义legend 选项卡 重置 粒度的具体实现
legend
通过变量来控制当前legend的隐藏或显示
              商品访问数


              商品成功支付数


              商品成功支付金额


              商品成功支付积分


              商品转化率
{
{orderCount}}
上一周期为
{
{previousOrderCount}}
此为选项卡的html代码 此选项卡没有用循环遍历的方式写 因为要对每个选项卡具体单独的操作
对checkbox进行双向绑定 通过change事件获取勾选事件 传入的参数对每个选项卡的单独判断
  checkedChange(checkedNum, select, type) {
      this.shade = true;
      if (!type) {
        //此为获取到所有的勾选的选项卡 存在当前变量中
        this.getSelectNum.push(checkedNum);
      }
      // select数据为  切换粒度再次调用的时候 传递的参数 为了控制 已选的数量不会添加
      // 通过选择的参数来判断是哪个选择框
      if (checkedNum == 1) {
        if (this.oderFormChecked1) {
          if (select != 2) {
            this.checkedStyle(checkedStyle1);
          }
          // 这是显示的图例
          this.oderFormChecked1 = true;
          // 获取到后端返回的 data
          this.oderFormOption.series[0].data = this.orderFormChartsList.orderCount;
        } else {
          this.getSelectNum.pop();
          // 隐藏图例
          this.oderFormChecked1 = false;
          //  清空当前条在图表option中的数据
          this.oderFormOption.series[0].data = [];
          // 改变取消勾选后的样式
          if (select != 2) {
            this.cancelStyle(checkedStyle1);
          }
        }
      } else if (checkedNum == 2) {
        if (this.oderFormChecked2) {
          if (select != 2) {
            this.checkedStyle(checkedStyle2);
          }

          this.oderFormChecked2 = true;
          this.oderFormOption.series[1].data = this.orderFormChartsList.paySuccessOrderCount;
        } else {
          this.getSelectNum.pop();
          this.oderFormChecked2 = false;
          this.oderFormOption.series[1].data = [];
          if (select != 2) {
            this.cancelStyle(checkedStyle2);
          }
        }
}
以上代码为当勾选了当前的选项卡后 对图表进行操作 赋值 显示当前选项卡的折线图

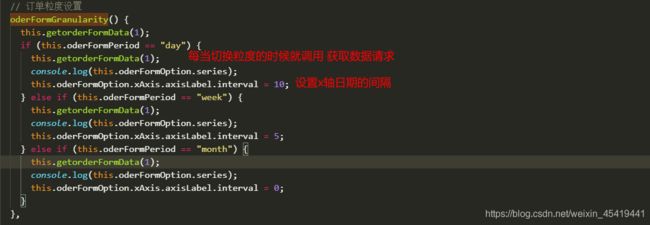
粒度
通过change时间 调用方法 对粒度进行操作
对粒度的解释

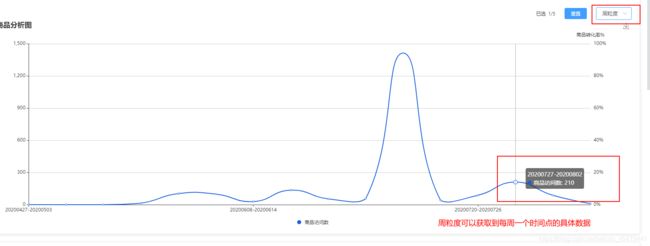

通过切换粒度 切换显示在图表上的具体数据
 // 订单粒度设置
    oderFormGranularity() {
      this.getorderFormData(1);
      if (this.oderFormPeriod == "day") {
        this.getorderFormData(1);
        console.log(this.oderFormOption.series);
        this.oderFormOption.xAxis.axisLabel.interval = 10;
      } else if (this.oderFormPeriod == "week") {
        this.getorderFormData(1);
        console.log(this.oderFormOption.series);
        this.oderFormOption.xAxis.axisLabel.interval = 5;
      } else if (this.oderFormPeriod == "month") {
        this.getorderFormData(1);
        console.log(this.oderFormOption.series);
        this.oderFormOption.xAxis.axisLabel.interval = 0;
      }
    },
切换粒度的时候 图例显示会有一个问题
大家可以回到选项卡事件中看
我是通过点击当前选项卡 传递参数进行判断把当前数据填充在当前的data中的
所以当我们勾选了 3个选项卡 显示了三条折线图 但是当切换粒度的时候 选项卡事件 checkedChange(checkedNum)
当前这个参数 只有最后一个选项卡的参数 所以我通过变量存储 push 每一个checkedNum的参数

这样子 当我切换 粒度的时候 调用 getorderFormData 这个方法

通过判断 进行 for循环遍历 获取到getSelectNum 中的数值(选择的选项卡编号) 进行遍历 然年多次调用checkedChange方法 然后把切换后的数据 一一替换之前粒度的数据
那么粒度就切换完成
重置
点击重置按钮 清空图表数据 清空勾选状态 清空已选项
 已选  {
    {oderFormselected}}/5
          重置
// 重置所有的checkbox
reset(type) {
this.shade = false;
// 重置数码为0
this.oderFormOption.series.forEach((item) => {
item.data = "";
});
this.oderFormChecked5 = false;
this.cancelStyle(checkedStyle5);
this.oderFormChecked4 = false;
this.cancelStyle(checkedStyle4);
this.oderFormChecked3 = false;
this.cancelStyle(checkedStyle3);
this.oderFormChecked2 = false;
this.cancelStyle(checkedStyle2);
this.oderFormChecked1 = false;
this.cancelStyle(checkedStyle1);
this.oderFormselected = 0;
},
以上为大概思路 因为代码步骤繁多 就不一一举例
水平有限 代码中 重复代码多 可优化点多 大牛勿喷