前言
最近公司组织了一场大咖秀,有位讲师建议我们没事多参加阿里的天池大赛,说是对提高自己很有帮助。于是想起自己几天前看到的FinanceR专栏的天池最后一公里,便紧随偶像步伐,注册并下载了一份数据,凑个热闹。详情请点击赛题介绍
此文为截图版,需要js交互版的原文请点击这里
简单分析
数据有三种类型的节点。第一类是Site,电商订单发货节点。第二类是Shop,O2O订单发货节点。第三类是Spot,消费者收获节点。电商订单的要求比较松,只需在当天晚上8点前配送完毕即可。O2O订单比较着急,必须在指定的时刻前去Shop取货,并在指定的时刻去Spot送货。
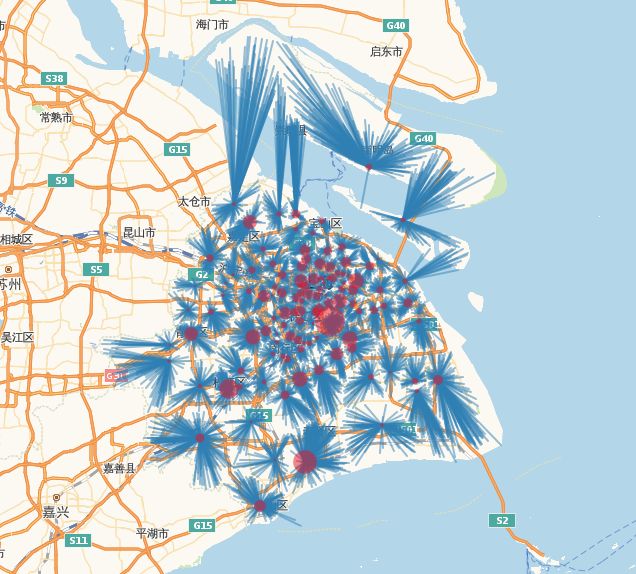
首先,我们将电商订单的情况打到地图上看一下。
library(readr)
library(plyr)
library(dplyr)
library(tidyr)
library(ggplot2)
library(plotly)
library(lubridate)
library(leaflet)
library(sp)
library(RColorBrewer)
library(jsonlite)
library(splitstackshape)
library(stringr)
library(rlist)

# 辅助函数
points2spline <- function(df, x_field, y_field, id_field){
  data <- as.matrix(df[,c(x_field, y_field)])
  id = df[1, id_field]
  Lines(list(Line(data)), ID=id)
}

# 探索Site与Spot的空间关系
df.site <- read_csv("1.csv")
df.spot <-  read_csv("2.csv")
df.e.order <- read_csv("4.csv")

df.site.spot <- df.e.order %>%
  inner_join(df.site, by=c("Site_id")) %>%
  inner_join(df.spot, by=c("Spot_id")) %>%
  unite(Point_x, ends_with("x")) %>%
  unite(Point_y, ends_with("y")) %>%
  gather(point, location, Point_x, Point_y) %>%
  separate(location, c("Lng", "Lat"), sep="_", convert=TRUE) %>%
  unite(Line_id, Site_id, Spot_id, remove=FALSE)

df.site <- df.site %>%
  inner_join(df.site.spot %>%
               group_by(Site_id) %>%
               dplyr::summarise(order_cnt=sum(Num)),
             by=c("Site_id"))

ls.site.spot <- split(df.site.spot, df.site.spot[, c("Line_id")])
names(ls.site.spot) <- NULL
sl.site.spot <- SpatialLines(llply(ls.site.spot, points2spline, "Lng", "Lat", "Line_id"))
m <- leaflet() %>%
  addTiles(
    'http://webrd02.is.autonavi.com/appmaptile?lang=zh_cn&size=1&scale=1&style=8&x={x}&y={y}&z={z}',
    tileOptions(tileSize=256, minZoom=9, maxZoom=17)
  ) %>%
  addPolylines(data=sl.site.spot, weight=2, color="#377EB8") %>%
  addCircleMarkers(lng=~Lng, lat=~Lat, radius=~order_cnt/1000, data=df.site, stroke=FALSE, fill=TRUE, fillColor="#E41A1C", fillOpacity=0.5, popup=~paste0("Order Num: ", order_cnt)) %>%
  fitBounds(sl.site.spot@bbox["x", "min"],sl.site.spot@bbox["y", "min"], sl.site.spot@bbox["x", "max"], sl.site.spot@bbox["y", "max"])
m
图中红色的圆圈就是每个Site,半径越长表明出货量越大。蓝色的线表示这个Site与它负责的电商订单的Spot的连线。可以看出Site和Spot之间是一一对应的关系,不存在交叉,所以如果只考虑电商订单,这就是一个比较简单的VRP问题,可以分而治之,每个Site单独规划。
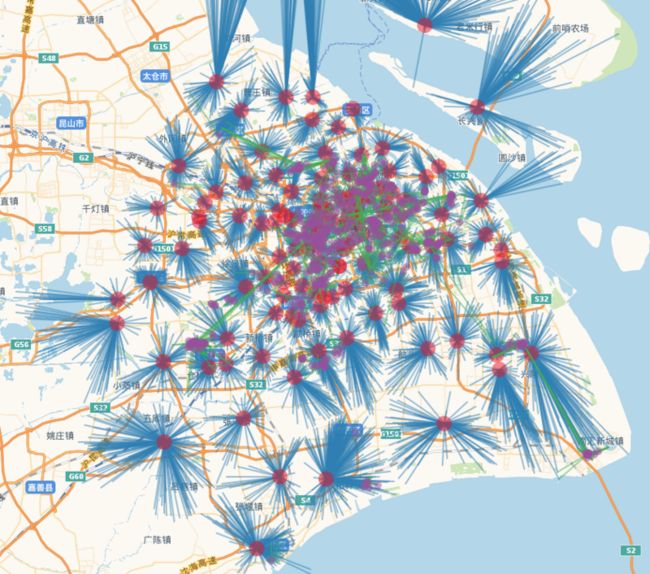
但是呢,我们还有一堆O2O订单要一起配送,这就让问题的复杂度骤然提升了难度。我们先来看一下O2O订单的空间分布。
df.shop <- read_csv("3.csv")
df.o2o.order <- read_csv("5.csv")

df.shop.spot <- df.o2o.order %>%
  inner_join(df.shop, by=c("Shop_id")) %>%
  inner_join(df.spot, by=c("Spot_id")) %>%
  unite(Point_x, ends_with("x")) %>%
  unite(Point_y, ends_with("y")) %>%
  gather(point, location, Point_x, Point_y) %>%
  separate(location, c("Lng", "Lat"), sep="_", convert=TRUE) %>%
  unite(Line_id, Shop_id, Spot_id, remove=FALSE)

ls.shop.spot <- split(df.shop.spot, df.shop.spot[, c("Line_id")])
names(ls.shop.spot) <- NULL
sl.shop.spot <- SpatialLines(llply(ls.shop.spot, points2spline, "Lng", "Lat", "Line_id"))

df.shop <- df.shop %>%
  inner_join(df.shop.spot %>%
               group_by(Shop_id) %>%
               dplyr::summarise(order_cnt=sum(Num)),
             by=c("Shop_id"))

m <- leaflet() %>%
  addTiles(
    'http://webrd02.is.autonavi.com/appmaptile?lang=zh_cn&size=1&scale=1&style=8&x={x}&y={y}&z={z}',
    tileOptions(tileSize=256, minZoom=9, maxZoom=17)
  ) %>%
  addPolylines(data=sl.shop.spot, weight=2, color="#4DAF4A") %>%
  addCircleMarkers(lng=~Lng, lat=~Lat, radius=~5, data=df.shop, stroke=FALSE, fill=TRUE, fillColor="#984EA3", fillOpacity=0.5, popup=~paste0("Order Num: ", order_cnt)) %>%
  fitBounds(sl.shop.spot@bbox["x", "min"],sl.shop.spot@bbox["y", "min"], sl.shop.spot@bbox["x", "max"], sl.shop.spot@bbox["y", "max"])
m
途中紫色的点为每个shop,绿线为O2O订单的spot与shop的连线。从空间上看,O2O的订单分布就比较散乱了。我们将O2O订单和电商订单的分布叠到一起看一下效果:
叠在一起后,我们能够很明显地看到O2O订单范围比电商范围小,集中在市区。
下面,我们模仿下FinanceR的思路,看一下O2O提单与配送时间的分布。
fake_dt <- "20160806"
o2o.hour <- df.o2o.order %>%
  mutate(pickup_hour=round_date(ymd_hm(paste0(fake_dt, Pickup_time)), "hour"),
         delivery_hour=round_date(ymd_hm(paste0(fake_dt, Delivery_time)), "hour")) %>%
  gather(time_type, tm, pickup_hour, delivery_hour) %>%
  group_by(time_type, tm) %>%
  summarise(order_cnt=n())
ggplot(o2o.hour) + geom_point(aes(x=tm, y=order_cnt, colour=time_type)) + geom_line(aes(x=tm, y=order_cnt, colour=time_type)) + theme_bw(base_size=16)
O2O订单有一个特点,就是比较碎。从数据中我们可以看到存在同一个spot在不同时刻向同一个shop下的订单。如果把这些碎订单拼凑在一起统一配送的话,能够节约很大成本。那么这种拼单思路的操作空间有多大呢?
df.o2o.order.batch <- df.o2o.order %>%
  mutate(batch_pickup_time = round_minute(ymd_hm(paste0(fake_dt, Pickup_time)), 30),
         batch_delivery_time = round_minute(ymd_hm(paste0(fake_dt, Delivery_time)), 30)) %>%
  group_by(Spot_id, Shop_id, batch_pickup_time, batch_delivery_time) %>%
  summarise(total_order_size=sum(Num), total_order_num=n())

table(df.o2o.order.batch$total_order_num)
在拼单的时候,考虑到用户体验,将pickup和delivery时刻取整为最近的30分钟时刻,再分组统计并单数量。结论是2975单无法拼单,143个订单能2单合并,4个订单能3单合并。所以,仿佛拼单预处理的优化空间不是很大,关键还是在这个配送问题本身。
VRP入门
最后一公里急速配送这个比赛,是一道十分困难的VRP问题。学术上,这种问题称为VRPPDPTW,添加的后缀PDP表示Pickup Delivery Problem,即允许沿途取货送货;TW表示Time Window,即配送存在时间窗口约束。这么复杂的问题,我这种菜鸟肯定是搞不定的。
所以本文暂且把O2O订单抛开,来解一解单纯的电商订单问题。前文已经提到,电商的最后一公里配送网规划得比较整齐,一个site对一个spot,order之间没有交集,因此可以逐个site求解。本文采用的方法是Saving Method。
# 辅助函数
## 赛题规定的两点距离计算公式
p2pdist <- function(lng1, lat1, lng2, lat2){
  diff_lat = (lat1 - lat2)/2
  diff_lng = (lng1 - lng2)/2
  coors_sum = (sin((pi * diff_lat )/180))^2 + cos((pi * lat1)/180) * cos((pi * lat2)/180)*(sin((pi * diff_lng )/180))^2
  result = 2 * 6378137 * asin (sqrt(coors_sum))
  return(result)
}

## 赛题规定的配送员默认速度是250m/min
distance_time_cost <- function(distance, speed=250) {
  return(round(distance/speed))
}

## 赛题规定的订单处理时间
processing_time_cost <- function(package_num) {
  return(round(3*sqrt(package_num) + 5))
}

# Saving Method
get_sub_data <- function(target.site, df.site, df.spot, df.e.order) {
  target.site.geo <- df.site %>%
    inner_join(df.e.order %>%
                 group_by(Site_id) %>%
                 dplyr::summarise(Num=sum(Num)),
               by=c("Site_id")) %>%
    filter(Site_id==target.site)
  target.spot.geo <- df.e.order %>%
    filter(Site_id==target.site) %>%
    inner_join(df.spot, by=c("Spot_id")) %>%
    arrange(Spot_id)

  target.site.geo$Index <- 0
  target.spot.geo$Index <- 1:nrow(target.spot.geo)
  points <- rbind(target.site.geo %>%
                    select(Index, Site_id, Lng, Lat, Num) %>%
                    dplyr::rename(ID=Site_id),
                  target.spot.geo %>%
                    select(Index, Spot_id, Lng, Lat, Num) %>%
                    dplyr::rename(ID=Spot_id)
  )
  return(points)
}

get_cost_matrix <- function(points.matrix) {
  cost.matrix <- matrix(0, nrow(points), nrow(points))
  for(i in 1:nrow(cost.matrix)) {
    for(j in i:nrow(cost.matrix)) {
      cost.matrix[i, j] = p2pdist(points.matrix[i, 1],
                                        points.matrix[i, 2],
                                        points.matrix[j, 1],
                                        points.matrix[j, 2])
    }
  }
  return(cost.matrix)
}

get_saving_matrix <- function(cost.matrix) {
  saving.matrix <- matrix(0, nrow(points)-1, nrow(points)-1)
  for(i in 2:(nrow(cost.matrix)-1)) {
    for(j in (i+1):nrow(cost.matrix)) {
      saving.matrix[i-1, j-1] = cost.matrix[1, i] + cost.matrix[1, j] - cost.matrix[i, j]
    }
  }
  return(saving.matrix)
}

get_vrp_init_solution <- function(demand.vec, cost.matrix) {
  route <- list()
  for(i in 1:nrow(demand.vec)) {
    load = as.integer(demand.vec[i, "Num"])
    processing_time = processing_time_cost(load)
    distance = 2*cost.matrix[1, i+1]
    distance_time = distance_time_cost(distance)
    route <- list.append(route,
        list(route_node=c(i),
             load=load,
             processing_time=processing_time,
             distance=distance,
             ddistance_time=distance_time
             )
        )
  }
  return(route)
}

get_vrp_saving_solution <- function(route, saving.matrix, capacity=140) {
  saving.idx <- order(saving.matrix, decreasing = T)
  for(k in 1:length(saving.idx)) {
    cur_saving <- saving.matrix[saving.idx[k]]
    if(cur_saving <= 0) {
      break
    }
    i <- saving.idx[k] %% nrow(saving.matrix)
    j <- saving.idx[k] %/% nrow(saving.matrix) + 1
    p1.idx <- list.which(route, i %in% route_node)[1]
    p2.idx <- list.which(route, j %in% route_node)[1]
    p1 <- route[[p1.idx]]
    p2 <- route[[p2.idx]]
    # Condition 1: i and j not in the same route
    if(p1.idx != p2.idx) {
      total_load <- p1$load + p2$load
      total_distance <- p1$distance + p2$distance - cur_saving
      total_processing_time <- p1$processing_time + p2$processing_time

      # Condition 2: combine load still less than capacity
      if(total_load < capacity) {
        idx1 <- which(p1$route_node == i)
        idx2 <- which(p2$route_node == j)
        # Condition 3: both i or j at the head or end of the route
        if(idx1 == 1 & idx2 == 1) {
          new_route_node <- c(rev(p1$route_node), p2$route_node)
        }
        else if(idx1 == length(p1$route_node) & idx2 == 1) {
          new_route_node <- c(p1$route_node, p2$route_node)
        }
        else if(idx1 == 1 & idx2 == length(p2$route_node)) {
          new_route_node <- c(p2$route_node, p1$route_node)
        }
        else if(idx1 == length(p1$route_node) & idx2 == length(p2$route_node)) {
          new_route_node <- c(p2$route_node, rev(p1$route_node))
        }
        else {
          next
        }
        route <- route %>%
          list.remove(c(p1.idx, p2.idx)) %>%
          list.append(list(route_node=new_route_node, load=total_load, processing_time=total_processing_time,
                           distance=total_distance, distance_time=distance_time_cost(total_distance)))
      }
    }
  }
  return(route)
}


## 绘制结果
plot_vrp_route <- function(route, points) {
  df.route <- route %>%
    list.map(list(spot_idx=str_c(route_node, collapse=","), load=load)) %>%
    list.stack() %>%
    mutate(id=1:length(route), Index=paste0("0,", spot_idx, ",0")) %>%
    cSplit(c("Index"), direction="long") %>%
    inner_join(points,
               by="Index")
  target.site.geo <- points %>% filter(Index == 0)
  ls.route <- split(df.route, df.route$id)
  names(ls.route) <- NULL
  sl.route <- SpatialLines(llply(ls.route, points2spline, "Lng", "Lat", "id"))
  ids <- data.frame(names(sl.route))
  colnames(ids) <- "id"
  sldf.route <- SpatialLinesDataFrame(sl.route, ids, match.ID = "id")

  factpal <- colorFactor(brewer.pal(8, "Dark2"), domain=df.route$id)

  m <- leaflet() %>%
    addTiles(
      'http://webrd02.is.autonavi.com/appmaptile?lang=zh_cn&size=1&scale=1&style=8&x={x}&y={y}&z={z}',
      tileOptions(tileSize=256, minZoom=9, maxZoom=17),
      group="高德地图"
    ) %>%
    addCircleMarkers(data=target.site.geo, radius=15, stroke=FALSE,
                     fill=TRUE, fillColor="#E41A1C", fillOpacity=0.8,
                     group="Site") %>%
    addCircleMarkers(lng=~Lng, lat=~Lat, radius=3, data=df.route, color=~factpal(id), group="Spot") %>%
    addPolylines(data=sldf.route, weight=3, color=~factpal(id), group="配送路线") %>%
    fitBounds(sldf.route@bbox["x", "min"], sldf.route@bbox["y", "min"], sldf.route@bbox["x", "max"], sldf.route@bbox["y", "max"]) %>%
    addLayersControl(
      baseGroups = c("配送路线"),
      overlayGroups = c("Site", "Spot", "高德地图"),
      options = layersControlOptions(collapsed = FALSE)
    )

  return(m)
}

## 普通VRP主函数
vrp_saving_method <- function(points) {
  points.matrix <- as.matrix(points %>% select(Lng, Lat))
  cost.matrix <- get_cost_matrix(points.matrix)
  demand.vec <- points %>%
    filter(Index != 0) %>%
    select(ID, Num)
  init_route <- get_vrp_init_solution(demand.vec, cost.matrix)
  saving.matrix <- get_saving_matrix(cost.matrix)

  saving_route <- get_vrp_saving_solution(init_route, saving.matrix)
  return(saving_route)
}


## 取出一个例子
target.site <- "A083"
points <- get_sub_data(target.site, df.site, df.spot, df.e.order)
saving_route <- vrp_saving_method(points)
plot_vrp_route(saving_route, points)
Saving Method规划的结果总体来看质量还是很不错的。简单说一下实现Saving Method的思路:构造cost矩阵和demand向量;构造初始解,即从site派专车送货到spot然后返回site;算saving matrix;将saving从大到小排序,逐个取出,判断这个saving对应的两个路线合并后车辆Capacity或时间窗等约束是否被满足,若满足则合并路径。其他常见的构造性的启发式算法还有Insert和Sweep;然后有一些听过大名的模拟退火、禁忌搜索等算法,不甚了解。由于学艺不精,时间有限,此题只能做到这里打住了。


