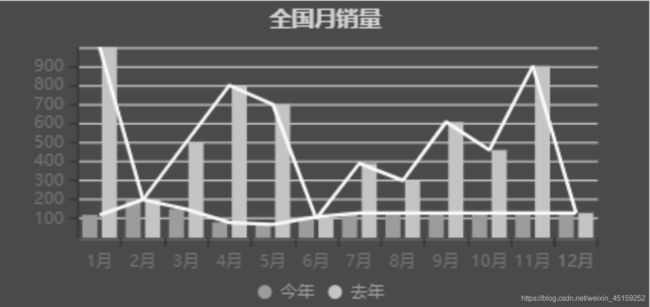
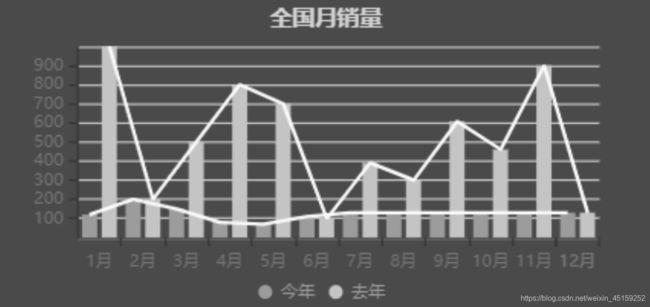
双柱状图与双折线图混合
问题: 双柱状图的时候,折线图不能从柱状图的中心点开始

解决方法:使用双x轴来控制折线的起始位置
代码
var option = {
        backgroundColor:'#4a4a4a',
        tooltip: {
            trigger: 'axis',
        },
        legend: {
            padding:0,
            itemGap:4,
            itemWidth:8,
            bottom:'2%',
            data:['今年','去年'],
            icon:'circle',
            textStyle:{
                fontSize:10,
                color:'#9b9b9b'
            }
        },
        title:{
            text:'全国月销量',
            left:'center',
            textStyle:{
                color:'#d5d5d5',
                fontSize:13,
            }
        },
        grid:{
            height:'62%',
            top:'15%',
            width:'80%',
            left:'12%'
        },
        xAxis: [{
            type: 'category',
            data: ['1月', '2月', '3月', '4月', '5月', '6月', '7月','8月','9月','10月','11月','12月'],
            axisLabel:{
                color:'#757575',
                fontSize:10,
                interval:0,
            }
        }, ],
        yAxis: {
            type: 'value',
            interval:100,
            axisLabel:{
                color:'#757575',
                fontSize:10
            }
        },
        series: [
            {
                name:'今年',
                data: [120, 200, 150, 80, 70, 110, 130, 130, 130, 130, 130, 130],
                type: 'bar',
                varWidth:'12px',
                itemStyle:{
                    color:'#9c9c9c'
                }
            },{
                name:'去年',
                data: [1000, 200, 500, 800, 700, 100, 390, 300, 607, 460, 900, 130],
                type: 'bar',
                varWidth:'12px',
                itemStyle:{
                    color:'#c4c4c4'
                }
            },
            {
                xAxisIndex:1,
                data: [120, 200, 150, 80, 70, 110, 130, 130, 130, 130, 130, 130],
                type: 'line',
                itemStyle:{
                    color:'#f9f9f9'
                },
                symbol:'none'
            },
            {
                xAxisIndex:1,
                data: [1000, 200, 500, 800, 700, 100, 390, 300, 607, 460, 900, 130],
                type: 'line',
                itemStyle:{
                    color:'#f9f9f9'
                },
                symbol:'none'
            },
        ]
    };
    // 增加了一个隐藏的x轴,用来控制线图的点的位置
    option.xAxis[1] = {
        type: 'value',
        max: option.xAxis[0].data.length * 100,
        show: false
    }
    option.series[2].data = option.series[2].data.map((x, i) => [27 + i * 100, x])
    option.series[3].data = option.series[3].data.map((x, i) => [73 + i * 100, x])
    var bar = echarts.init(document.getElementById('bar'));
    bar.setOption(option);
