在SQL Server Management Studio(SSMS)中调试存储过程
Debugging is one of the most important but painful parts of any software process. To find some errors you have to run the code step by step to see which section of the code is responsible for the error. This is called runtime debugging.
调试是任何软件过程中最重要但又很痛苦的部分之一。 要查找一些错误,您必须逐步运行代码以查看引起错误的代码部分。 这称为运行时调试。
Luckily, SQL Server Management Studio (SSMS) comes with automated debugging capabilities to help developers debug their scripts. In this article, we will explain practically how SSMS can be used to debug stored procedures in SQL Server by working through a very simple example.
幸运的是,SQL Server Management Studio(SSMS)具有自动调试功能,可帮助开发人员调试其脚本。 在本文中,我们将通过一个非常简单的示例来实际说明如何在SQL Server中使用SSMS调试存储过程。
例 (Example)
For our example, we will use a stored procedure “spShowOddNumbers” that takes two numbers as its parameters and prints all the odd numbers between those two specified numbers.
对于我们的示例,我们将使用一个存储过程“ spShowOddNumbers”,该过程将两个数字作为参数并打印这两个指定数字之间的所有奇数。
CREATE PROCEDURE spShowOddNumbers
@LowerRange INT,
@UpperRange INT
AS
BEGIN
  WHILE(@LowerRange < @UpperRange)
  BEGIN
    if(@LowerRange%2 != 0)
    BEGIN
      PRINT @LowerRange
    END
    SET @LowerRange = @LowerRange + 1
  END
  PRINT 'PRINTED ODD NUMBERS BETWEEN ' + RTRIM(@lowerRange) + ' and ' + RTRIM(@UpperRange)
END
The script that calls the stored procedure in SQL Server:
在SQL Server中调用存储过程的脚本:
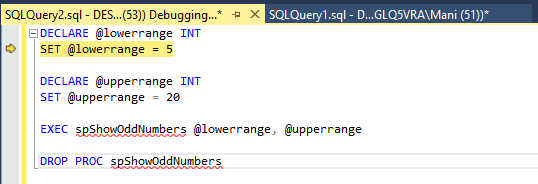
DECLARE @lowerrange INT
SET @lowerrange = 5

DECLARE @upperrange INT
SET @upperrange = 20

EXEC spShowOddNumbers @lowerrange, @upperrange

DROP PROC spShowOddNumbers
调试选项 (Debugging options)
In SQL Server Management Studio, you have a variety of debugging options.
在SQL Server Management Studio中,您有多种调试选项。
开始调试 (Start Debugging)
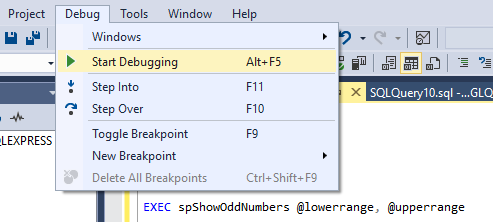
To start debugging a SQL server stored procedure in SQL Server, press ALT + F5, or go to Debug -> Start Debugging, as shown in the figure below:
要开始在SQL Server中调试SQL Server存储过程,请按ALT + F5,或转到Debug-> Start Debugging,如下图所示:
After starting the debugger in the window where you are calling your stored procedure in SQL Server, you will see that there will be a yellow cursor at the start of the query window as shown below:
在要在SQL Server中调用存储过程的窗口中启动调试器之后,您将看到在查询窗口的开始处将出现一个黄色光标,如下所示:
Now you have started debugging you can step through the code.
现在,您已经开始调试,可以逐步执行代码。
单步执行脚本 (Stepping Through Script)
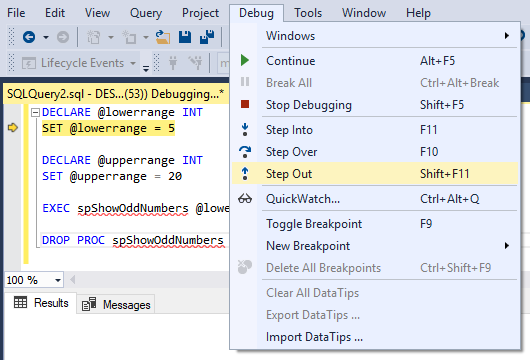
There are three options to step through the code: 1) Step Over, 2) Step Into and 3) Step Out. You can see these options by clicking Debug as shown in the screenshot below:
共有3个选项可以逐步执行代码:1)单步执行,2)单步执行和3)单步执行。 您可以通过单击Debug来查看这些选项,如下面的屏幕快照所示:
- Step Over (F 10) 跨步(F 10)
Step Over simply moves the cursor to the next line of executable script. For instance, if the debugger is at the following location in the script:
单步执行只是将光标移动到可执行脚本的下一行。 例如,如果调试器在脚本中的以下位置:
Clicking Step Over or pressing F10 simply moves the cursor to the following line:
单击“跳过”或按F10只是将光标移至以下行:
- Step Into (F 11) 步入(F 11)
This is one of the most important and useful debugging features. Step Into lets you break into the stored procedure script from the script that calls that stored procedure.
这是最重要和有用的调试功能之一。 单步执行可让您从调用该存储过程的脚本中闯入该存储过程脚本。
It is important to mention that Step Into works like Step Over. If the line of script being executed doesn’t contain any call to the stored procedure in SQL Server.
重要的是要提到Step Into就像Step Over一样 。 如果正在执行的脚本行不包含对SQL Server中存储过程的任何调用。
For instance if you Step Into at:
例如,如果您进入:
SET @upperrange = 20The debugger will simply move the control to the next line:
调试器将简单地将控件移至下一行:
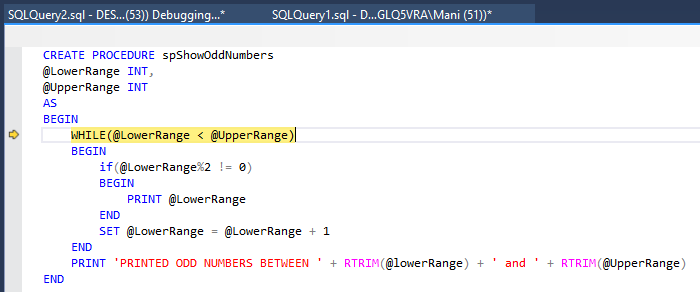
EXEC spShowOddNumbers @lowerrange, @upperrangeThe above line contains a call to the stored procedure in SQL Server. Now if you Step Into at this line of script, the debugger will take you to the script of ‘spShowOddNumbers’ stored procedure as shown in the following figure.
上一行包含对SQL Server中存储过程的调用。 现在,如果您进入此脚本行,调试器将带您进入“ spShowOddNumbers”存储过程的脚本,如下图所示。
- Step Out (Shift + F11) 跳出(Shift + F11)
Step Out is the opposite of Step Into. If you are inside a stored procedure in SQL Server and you want to go back to the script that calls the stored procedure you can use Step Out. For instance, if you click Step Over at:
“跳出 ”与“ 跳入 ”相反。 如果您在SQL Server中的存储过程中,并且想返回调用存储过程的脚本,则可以使用“跳出”。 例如,如果您单击“跳过”:
WHILE(@LowerRange < @UpperRange)The debugger will take you back to the script that calls the function i.e.
调试器将带您回到调用该函数的脚本,即
游标 (Run To Cursor)
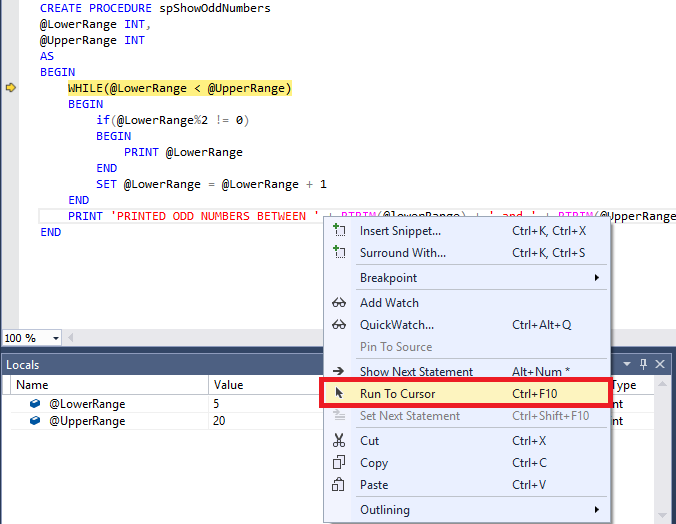
Debugging options execute one line at a time. If there is a loop or a long piece of code that you want your debugger to skip, you can use the ‘Run To Cursor’ option.
调试选项一次执行一行。 如果您希望调试器跳过某个循环或一长段代码,则可以使用“运行至光标”选项。
WHILE(@LowerRange < @UpperRange)
For instance, if the cursor is at the following line of the stored procedure in SQL Server and you want to skip the loop and go to the print statement after the loop. You can simply go the print statement and click “Run To Cursor” as shown below:
例如,如果光标位于SQL Server中存储过程的下一行,并且您想跳过循环并在循环后转到print语句。 您可以简单地转到打印语句,然后单击“运行到光标”,如下所示:
The loop will be skipped and your cursor will now point at the print statement.
循环将被跳过,您的光标现在将指向print语句。
本地窗口 (The Local Window)
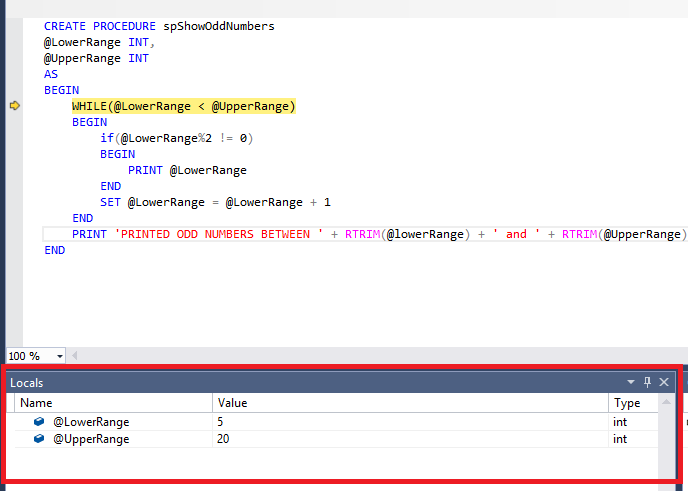
The local window helps you keep track of the values of the variables in the script. In this example, we have two variables @LowerRange and @UpperRange in our script. At the start of the while loop in the stored procedure in SQL Server the value of @LowerRange variable is 5 while the @UpperRange variable is 20 as shown in the figure below:
本地窗口可帮助您跟踪脚本中变量的值。 在此示例中,脚本中有两个变量@LowerRange和@UpperRange。 在SQL Server中存储过程的while循环开始时,@ LowerRange变量的值为5,而@UpperRange变量的值为20,如下图所示:
Once you execute the loop and then check the value of the variables you will see that the @LowerRange and @UpperRange variables will both show 20 as their value. The Locals window displays the Name, Value, and Type of the variable. Using the Locals window makes it very simple to can keep track of the changes in the values of your variables as you progress through the script.
一旦执行了循环,然后检查了变量的值,您将看到@LowerRange和@UpperRange变量都将显示20作为其值。 Locals窗口显示变量的名称,值和类型。 使用“本地”窗口可以非常轻松地跟踪脚本执行过程中变量值的变化。
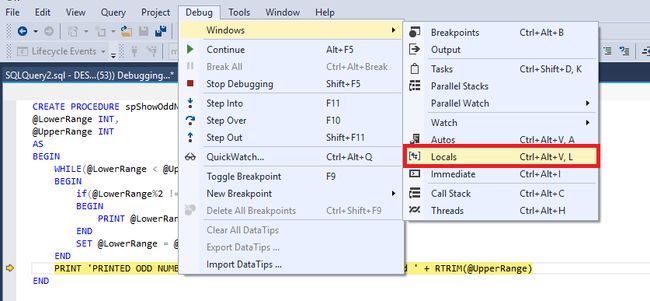
If you close the Locals window accidentally and you want to bring it back, you can simply go to Debug -> Windows -> Locals as shown below:
如果您不小心关闭了Locals窗口并想将其恢复,则只需转到Debug-> Windows-> Locals,如下所示:
监视窗口 (The Watch Window)
The Watch window is very similar to the Locals window. The only difference is that you can add to or remove variables from the Watch window, which can be useful when working with large numbers of variables in larger scripts.
“监视”窗口与“本地”窗口非常相似。 唯一的区别是您可以在“监视”窗口中添加或删除变量,这在较大的脚本中使用大量变量时非常有用。
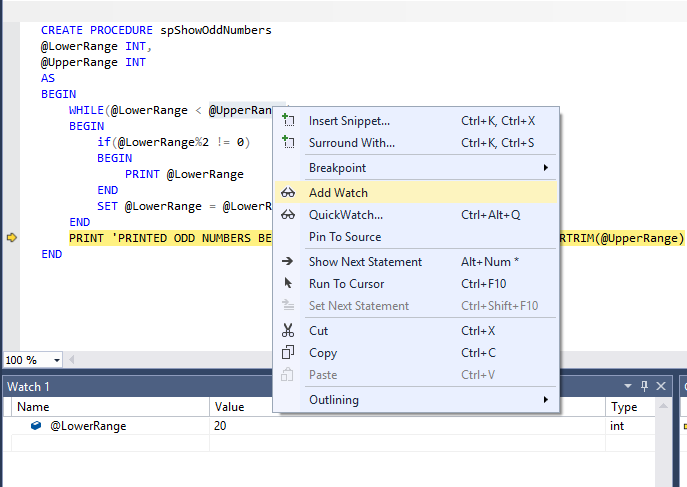
To add a variable to the Watch window, simply select the variable, right click and then select “Add Watch” as shown in the following screenshot:
要将变量添加到“监视”窗口,只需选择该变量,右键单击,然后选择“添加监视”,如以下屏幕截图所示:
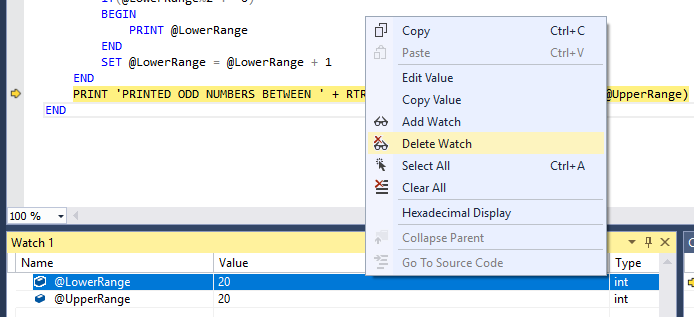
Similarly, to remove a variable, right-click the name of the variable in the Watch window and click “Delete Watch” from the list of options. As shown below:
同样,要删除变量,请在“监视”窗口中右键单击该变量的名称,然后从选项列表中单击“删除监视”。 如下所示:
调用堆栈 (The Call Stack)
The Call Stack, as the name suggests, displays the stack of calls that have been executed up to the current point.
顾名思义,“呼叫堆栈”显示到当前点为止已执行的呼叫堆栈。
The first line of the Call Stack in the figure above, tells us that currently the spShowOddNumbers stored procedure is being executed and at the moment the debugger is at line 14 of the file that contains this stored procedure. The second line indicates that this stored procedure was called from the script at Line 7 of the SQLQuery2.sql file.
上图中的调用堆栈的第一行告诉我们当前正在执行spShowOddNumbers存储过程,此刻调试器位于包含该存储过程的文件的第14行。 第二行表明此存储过程是从SQLQuery2.sql文件的第7行的脚本中调用的。
立即窗口 (The Immediate Window)
The Immediate window is similar to the console window. For example, you can perform mathematical operations within the Immediate window, check for the values of variables, etc. The following screenshot contains an example of an immediate window.
立即窗口类似于控制台窗口。 例如,您可以在即时窗口中执行数学运算,检查变量的值等。以下屏幕快照包含即时窗口的示例。
Note: cls command clears the immediate window!
注意: cls命令清除立即窗口!
断点 (Breakpoints)
A breakpoint is one of the most commonly used debugging tools in any programming language. Breakpoint lets you specify the location where you want your debugger to stop executing the code. They come particularly in handy when you don’t want to debug all the lines of code, rather you want to check the status of variables at specific locations in your code.
断点是任何编程语言中最常用的调试工具之一。 使用Breakpoint,可以指定调试器停止执行代码的位置。 当您不想调试所有代码行,而是想检查代码中特定位置的变量状态时,它们特别有用。
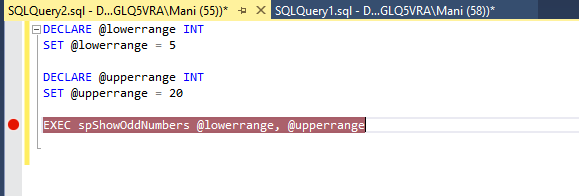
To put a breakpoint in your code, simply right click on the grey area to the left side of the line of the script where you want to put your breakpoint. Alternatively, pressing F9 will automatically add a breakpoint to the line. Pressing the F9 key again will remove the breakpoint.
要在代码中放置一个断点,只需右键单击要在其中放置断点的脚本行左侧的灰色区域。 或者,按F9将自动向该行添加一个断点。 再次按F9键将删除断点。
You can see in the figure above, that a breakpoint has been added to the line that executes the “spShowOddNumbers” stored procedure in SQL Server. Now, debug this script. You will see that the debugger will start at first line of the script.
您可以在上图中看到,已经在执行SQL Server中“ spShowOddNumbers”存储过程的行中添加了一个断点。 现在,调试此脚本。 您将看到调试器将从脚本的第一行开始。
Now press ALT + F5 or go to the debug menu again and click Debug -> Continue. You will see that instead of debugging the next line, the debugger will jump straight to the nearest line with the breakpoint.
现在按ALT + F5或再次转到调试菜单,然后单击调试->继续。 您将看到,调试器将直接跳到带有断点的最近一行,而不是调试下一行。
You can also create conditional breakpoints. Conditional breakpoints are hit only when specified conditions are met.
您还可以创建条件断点。 仅当满足指定条件时,才会触发条件断点。
To specify a condition on the breakpoint, simply right click the breakpoint and select “Conditions” as shown in the figure below:
要在断点上指定条件,只需右键单击断点,然后选择“条件”,如下图所示:
A new window will be opened where you can specify the conditions to be satisfied before a breakpoint can hit. If you want this breakpoint to only be hit when @LowerRange is greater than 15, you could add this as condition, as shown in the image below:
将打开一个新窗口,您可以在其中指定要命中断点之前要满足的条件。 如果仅在@LowerRange大于15时才击中该断点,则可以将此条件添加为条件,如下图所示:
结论 (Conclusion)
In this article, we discussed what different options does Microsoft SQL Server Management Studio provides for debugging a script or stored procedure in SQL Server.
在本文中,我们讨论了Microsoft SQL Server Management Studio提供了哪些不同的选项来调试SQL Server中的脚本或存储过程。
本的其他精彩文章 (Other great articles from Ben)
| How to use SQL Server built-in functions and create user-defined scalar functions |
| How To Use Window Functions |
| Debugging stored procedures in SQL Server Management Studio (SSMS) |
| 如何使用SQL Server内置函数和创建用户定义的标量函数 |
| 如何使用视窗功能 |
| 在SQL Server Management Studio(SSMS)中调试存储过程 |
翻译自: https://www.sqlshack.com/debugging-stored-procedures-sql-server-management-studio-ssms/
