在vue项目中使用Antv-f2的小案例
目录
一.两种引入方式
1.浏览器引入
2.通过 npm 安装
二. 两种使用方式
1. 在配置了webpack或使用vue-cli构建的vue项目使用
2. 另一种使用方式是在html中直接使用
三. vue循环渲染图表,动态绑定Id
最近在研究数据可视化,了解到会有移动端的数据可视化需求,所以看到了阿里出的Antv F2.
官网有如下简介: F2,一个专注于移动,开箱即用的可视化解决方案,完美支持 H5 环境同时兼容多种环境(node, 小程序,weex)。完备的图形语法理论,满足你的各种可视化需求。专业的移动设计指引为你带来最佳的移动端图表体验。 那我们在vue项目中应当如何使用呢?
一.两种引入方式
1.浏览器引入
既可以通过将脚本下载到本地也可以直接引入在线资源。
引入在线资源
友情提醒:请按需更新版本号。
引入本地脚本
你也可以直接通过 unpkg 下载。
2.通过 npm 安装
npm install @antv/f2 --save
安装完之后,在入口文件main.js里引入
import F2 from '@antv/f2'
Vue.prototype.$F2= F2;
二. 两种使用方式
1. 在配置了webpack或使用vue-cli构建的vue项目使用
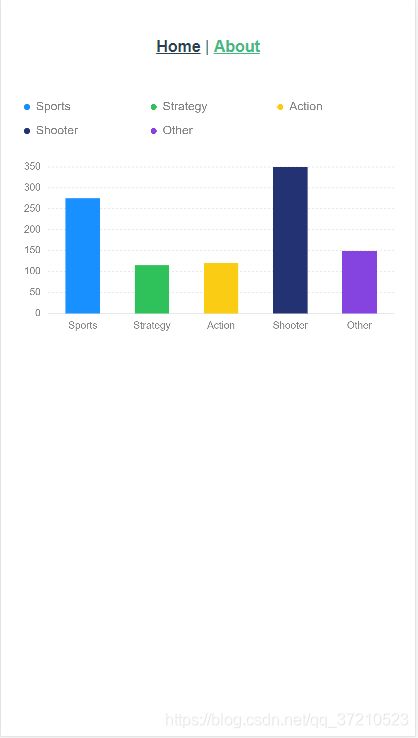
在chart.vue组件中使用F2构建图表:
export default {
  name:'about',
  data(){
    return {
      data:[
         { genre: 'Sports', sold: 275 },
         { genre: 'Strategy', sold: 115 },
         { genre: 'Action', sold: 120 },
         { genre: 'Shooter', sold: 350 },
         { genre: 'Other', sold: 150 }
      ]
    }
  },
  methods:{
    drawChart(){
      // Step 1: 创建 Chart 对象
      const chart = new this.$F2.Chart({
        id: 'myChart',
        pixelRatio: window.devicePixelRatio // 指定分辨率
      });

      // Step 2: 载入数据源
      console.log(this.data);
      chart.source(this.data);

      // Step 3:创建图形语法,绘制柱状图,由 genre 和 sold 两个属性决定图形位置,genre 映射至 x 轴,sold 映射至 y 轴
      chart.interval().position('genre*sold').color('genre');

      // Step 4: 渲染图表
      chart.render();
    }
  },
  mounted(){
    var v = this;
    this.$nextTick(()=>{
      v.drawChart();
    });
  },
  created(){

  }
}
为什么我们要将调用画图的函数放置到vue.$nextTick函数里面呢? 因为我们要保证dom渲染完成之后去获取dom元素,再进行画图。如果这里我们不放置到这个函数里面,会报找不到ID的错误。
2. 另一种使用方式是在html中直接使用
html引入部分的代码
script代码
window.onload = function(){
        var vm = new Vue({
            el: '#app',
            data(){
                return {
                    data:[],
                }
            },
            methods:{
                getData(){
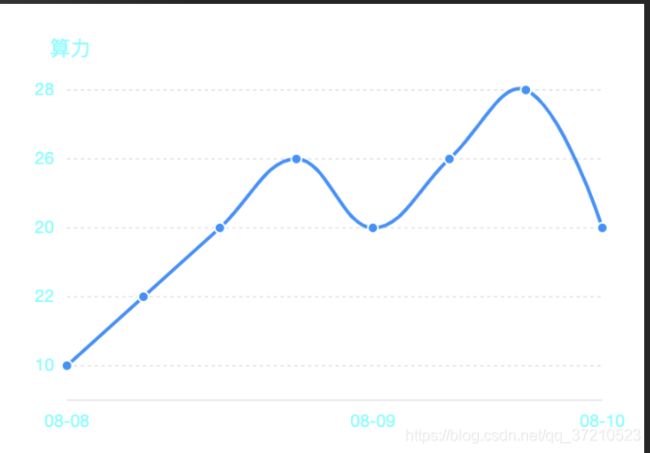
                    let list = [{"tem":"10","time":"2016-08-08 00:00:00"},{"tem":"22","time":"2016-08-08 00:10:00"},{"tem":"20","time":"2016-08-08 00:30:00"},{"tem":"26","time":"2016-08-09 00:35:00"},{"tem":"20","time":"2016-08-09 01:00:00"},{"tem":"26","time":"2016-08-09 01:20:00"},{"tem":"28","time":"2016-08-10 01:40:00"},{"tem":"20","time":"2016-08-10 02:00:00"}];
                    var chart = new F2.Chart({
                        id: 'mountNode',
                        pixelRatio: window.devicePixelRatio,
                        padding: [ 30, 24, 30, 40],
                    });
                    var defs = {
                        time: {
                            type: 'timeCat',
                            mask: 'MM-DD',
                            tickCount: 3,
                            range: [0, 1]
                        },
                        tem: {
                            tickCount: 5,
                            min: 0,
                            alias: '算力'
                        }
                    };
                    if(list.length>0){
                        chart.source(list, defs);
                        chart.axis('time', {
                            label: function label(text, index, total) {
                            var textCfg = {};
                            if (index === 0) {
                                textCfg.textAlign = 'left';
                            } else if (index === total - 1) {
                                textCfg.textAlign = 'right';
                            }
                            return textCfg;
                            }
                        });
                        chart.axis('time',{
                            label: {
                                fill: '#52FFFF'
                            }
                        });
                        chart.axis('tem',{
                            label: {
                                fill: '#52FFFF'
                            }
                        });
                        chart.tooltip({
                            showCrosshairs: true,
                        });
                        chart.guide().text({
                            position: [ 'min', 'max' ], // x 轴最小值, y 轴最大值
                            content: '算力',
                            style: {
                                textAlign: 'start',
                                textBaseline: 'top',
                                fill:'#52FFFF'
                            },
                            offsetY: -10,
                            offsetX: -10, // 可以通过 padding 值配合来保证显示位置
                        });
                        chart.line().position('time*tem').shape('smooth');
                        chart.point().position('time*tem').shape('smooth').style({
                            stroke: '#fff',
                            lineWidth: 1
                        });
                        chart.render();
                        // document.getElementById("secondid").value = list;
                    }
                },
            },
            mounted(){
                this.getData();
            }
        })
  }
三. vue循环渲染图表,动态绑定Id
需求是后端返回一个图表数组, 前端需要展示这个数组,难点就是每个图表都需要绘制一个canvas, 并且每个id需要唯一, 所以就可以借助数组下标的索引值为id名称,具体如下:
html代码
js代码
import BlockService from '@/services/BlockService'
  export default {
    data(){
      return {
        chartList:[], //图表数据
      }
    },
    methods:{
      getData(datas){
        let defs = {
            day: {
                type: 'timeCat',
                mask: 'MM-DD',
                tickCount: 3,
                range: [0, 1]
            },
            values: {
                tickCount: 5,
                min: 0,
                alias: name
            }
        };
        let chart = {};
        this.$nextTick(() =>{
          for(let i=0;i0){
                chart[i].source(datas[i].values, defs);
                chart[i].axis('day', {
                    label: function label(text, index, total) {
                    var textCfg = {};
                    if (0 === 0) {
                        textCfg.textAlign = 'left';
                    } else if (0 === total - 1) {
                        textCfg.textAlign = 'right';
                    }
                    return textCfg;
                    }
                });
                chart[i].axis('day',{
                    label: {
                        fill: '#52FFFF'
                    }
                });
                chart[i].axis('values',{
                    label: {
                        fill: '#52FFFF'
                    }
                });
                chart[i].tooltip({
                    showCrosshairs: true,
                });
                chart[i].guide().text({
                    position: [ 'min', 'max' ], // x 轴最小值, y 轴最大值
                    content: datas[i].name,
                    style: {
                        textAlign: 'start',
                        textBaseline: 'top',
                        fill:'#52FFFF'
                    },
                    offsetY: -20,
                    offsetX: -20, // 可以通过 padding 值配合来保证显示位置
                });
                chart[i].line().position('day*values').shape('smooth');
                chart[i].point().position('day*values').shape('smooth').style({
                    stroke: '#fff',
                    lineWidth: 1
                });
                chart[i].render();
            }
          }
        });

      },
    },
    created(){
      BlockService.getChartList(this, data=>{
        this.chartList = data;
        this.getData(data);
      })
    }
  }
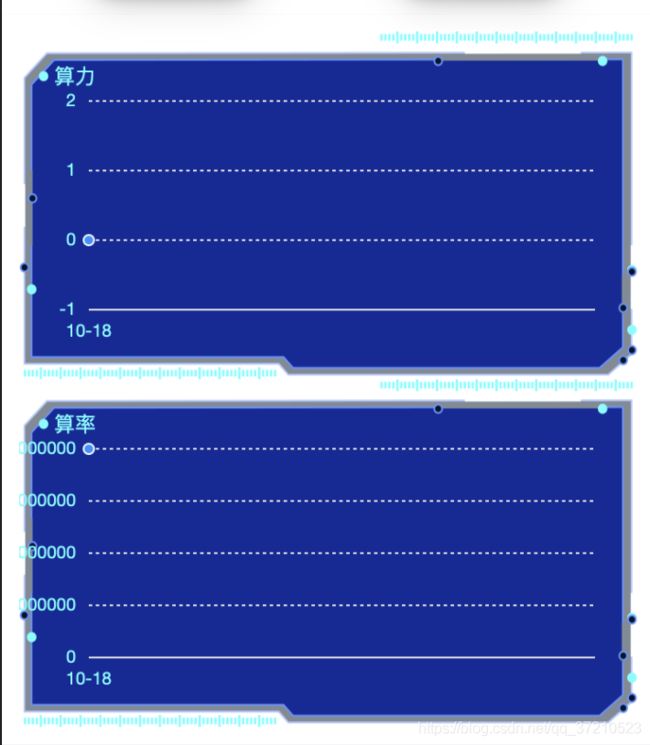
上面代码中, datas是从接口获取的图表数组, 含有多个图表的数据,后端返回的数据接口如下:
{
    "code":0,
    "message":"success",
    "data":[
        {
            "values":[
                {
                    "values":0,
                    "day":"2019-10-18"
                }
            ],
            "name":"算力",
            "templateId":"02d9f54bd0154832b5cdddde5c479756"
        },
        {
            "values":[
                {
                    "values":99964647,
                    "day":"2019-10-18"
                }
            ],
            "name":"算率",
            "templateId":"202b9359c43d4096ad94d3eba0388612"
        }
    ]
}
效果图:
说明: 1. id要保证唯一, 需要使用数组下标作为标识,
2. 使用f2有个不太灵活的地方, 后端返回的数据字段名称要跟绘制图表的横纵坐标对应, 上面代码,day对应横坐标的日期, values对应纵坐标的数值.
3. 在绘制图表的函数中,一定要放在vue的$nextTick方法里, 否则会找不到对应id, 图表无法渲染, 这点很重要.
更新
需求1: toolTip提示框显示纵坐标名称
实现:
  chart[i].tooltip({
     showCrosshairs: true, //是否显示辅助线
     crosshairsStyle: {
           stroke: 'rgba(255,255,255,.25)',
           lineWidth: 2
     }, // 配置辅助线的样式
     snap: true,
     showTitle:true,
     offsetY: 20, // y 方向的偏移
     onShow: function onShow(ev) {
          var items = ev.items;
          items[0].name = datas[i].name; //name为需要显示的纵坐标的名称
     },
  });
需求2:纵坐标需要显示百分比%
实现:
把上面的onShow函数加上以下代码
 onShow: function onShow(ev) {
     var items = ev.items;
     items[0].name = datas[i].name;
       if(datas[i].name == '算率'){
         items[0].value = (items[0].value*100).toFixed(2) + '%';
       }else{
                        items[0].value = items[0].value
        }
  },


