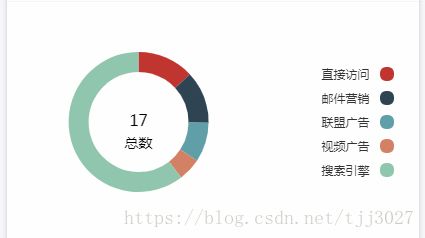
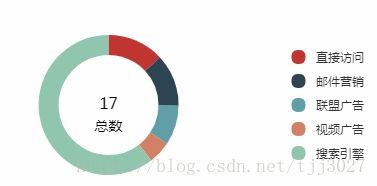
echart--pie图
pie图初始化
1.环形图中间添加描述
使用zrender渲染方式
早期方式:
var _ZR = myChart.getZrender();
var TextShape = require('zrender/shape/Text');
_ZR.addShape(new TextShape({
    hoverable : false,
    style : {
        x : _ZR.getWidth() * 0.5,
        y : _ZR.getHeight() / 2,
        color: "red",
        textFont: 'normal 14px Microsoft YaHei',
        text : "总数\n"+total,
        textAlign : 'center'
    }
}));
_ZR.refresh();
现在的方式:
var _ZR = myChart.getZr();
_ZR.add(new echarts.graphic.Text({
    hoverable: false,
    style: {
        x: _ZR.getWidth() * 0.5,
        y: _ZR.getHeight() / 2-10,
        textFill: "red",//设置文字颜色
        textFont: 'normal 16px Microsoft YaHei',
        text:17,
        textAlign: 'center'
    }
}));
数据更新问题:
var _ZR = myChart.getZr();
var text=new echarts.graphic.Text({
    hoverable: false,
    style: {
        x: _ZR.getWidth() * 0.5,
        y: _ZR.getHeight() / 2-10,
        textFill: "red",//设置文字颜色
        textFont: 'normal 16px Microsoft YaHei',
        text:17,
        textAlign: 'center'
    }
})
_ZR.add(text);

text.attr('style', {
    text: total
})
使用title属性
option 中添加属性:
        text: '{a|1000}',
        subtext: '{b|总数}',
        x: '30',
        y: '36%',
        itemGap: 0,
        padding: 0,
        textStyle: {
            rich: {
                a: {//富文本设置文字居中
                    fontWeight: 'normal',
                    lineHeight: 28,
                    height: 28,
                    color: '#666666',
                    width: 140,
                    fontSize: 28,
                    align: 'center'
                }
            }
        },
        subtextStyle: {
            rich: {
                b: {
                    color: '#666666',
                    fontSize: 12,
                    lineHeight: 12,
                    height: 12,
                    align: 'center',
                    width: 140
                }
            }
        }
数据更新问题:
opt.title.text = '{a|' + total + '}';
echart.setOption(opt)
2.图例左右问题:当图例位置在右下角时默认文字描述变成左侧
展示的图例文字描述在左边:

希望文字在图例右侧:

解决方法:
legend: {
    orient: 'vertical',
    y: 'center',
    x: 'right',
    align:'left',
}
3.初始化图表
    var myChart = echarts.init(document.getElementById('divId'));
    myChart.hideLoading();
    var pieInfoOption = {
        /*title:{
            text:"17",
            subtext: '总数',
            left:"26%",
            top:"40%",
        },*/
        tooltip: {
            trigger: 'item',
            formatter: "{a}
{b}: {c} ({d}%)"
        },
        legend: {
            orient: 'vertical',
            y: 'bottom',
            x: 'right',
            //align:'left',
            data: [{
                name: '直接访问',
                icon: 'circle',
                textStyle: {

                }
            }, {
                name: '邮件营销',
                icon: 'circle'
            }, {
                name: '联盟广告',
                icon: 'circle'
            }, {
                name: '视频广告',
                icon: 'circle'
            }, {
                name: '搜索引擎',
                icon: 'circle'
            }],
            formatter: function(params) {
                return params;
            }
        },
        series: [{
            name: '访问来源',
            type: 'pie',
            radius: ['50%', '70%'],
            avoidLabelOverlap: false,
            label: {
                normal: {
                    show: false,
                },
                emphasis: {
                    show: false,
                }
            },
            labelLine: {
                normal: {
                    show: false
                }
            },
            data: [{
                    value: 335,
                    name: '直接访问'
                },
                {
                    value: 310,
                    name: '邮件营销'
                },
                {
                    value: 234,
                    name: '联盟广告'
                },
                {
                    value: 135,
                    name: '视频广告'
                },
                {
                    value: 1548,
                    name: '搜索引擎'
                }
            ]
        }]
    };

    myChart.setOption(pieInfoOption);
    var _ZR = myChart.getZr();
    log(_ZR)
    // var TextShape = require('zrender/shape/Text');
    _ZR.add(new echarts.graphic.Text({
        hoverable: false,
        style: {
            x: _ZR.getWidth() * 0.5,
            y: _ZR.getHeight() / 2-10,
            color: "#000000",
            textFont: 'normal 16px Microsoft YaHei',
            text:17,
            textAlign: 'center'
        }
    }));
        _ZR.add(new echarts.graphic.Text({
        hoverable: false,
        style: {
            x: _ZR.getWidth() * 0.5,
            y: _ZR.getHeight() / 2,
            color: "#ff0000",
            textFont: 'normal 14px Microsoft YaHei',
            text:"\n"+ "总数",
            textAlign: 'center'
        }
    }));
    _ZR.refresh();