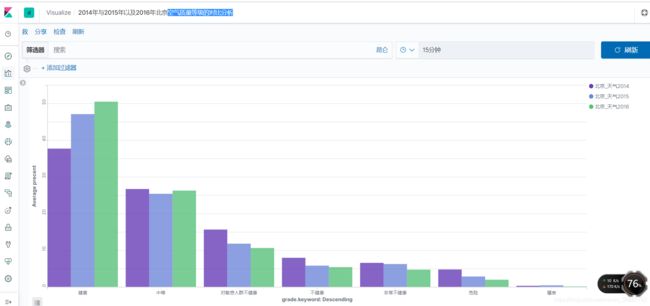
使用PySpark分析空气质量并写入Elasticsearch
1、 需求:使用PySpark分析空气质量
2、数据集:北京市PM2.5数据
3、技术版本
Spark:spark-2.2.1-bin-hadoop2.6.tgz
Python:Python-3.7.2.tar.xz
ElasticSearch:elasticsearch-7.2.0.tar.gz
Kibana:kibana-7.2.0.tar.gz
elasticsearch-spark-20_2.11-7.2.0.jar
4、代码:
from pyspark.sql import SparkSession
from pyspark.sql.types import *
from pyspark.sql.functions import udf

"""
北京2014年-2016年空气质量分析实战,写入ES中
"""
def get_grade(value):
    if value <=50 and value >=0:
        return "健康"
    elif value <=100:
        return "中等"
    elif value <=150:
        return "对敏感人群不健康"
    elif value <=200:
        return "不健康"
    elif value <=300:
        return "非常不健康"
    elif value <=500:
        return "危险"
    elif value >500:
        return "爆表"
    else:
        return None


if __name__ == '__main__':
    """"
    csv 设置头部信息
    .option("header","true")      --设置头部信息
    .option("inferSchema","true") --自动推导数据类型
    """
    spark = SparkSession.builder.appName("airAnalyse").getOrCreate()
    data2014 = spark.read.format("csv").option("header","true").option("inferSchema","true").load("/kongqizhiliang/Beijing_2014_HourlyPM25_created20150203.csv")
    data2015 = spark.read.format("csv").option("header","true").option("inferSchema","true").load("/kongqizhiliang/Beijing_2015_HourlyPM25_created20160201.csv")
    data2016 = spark.read.format("csv").option("header","true").option("inferSchema","true").load("/kongqizhiliang/Beijing_2016_HourlyPM25_created20170201.csv")

    # 使用udf函数进行转换
    get_function_udf = udf(get_grade,StringType())
    # groupby + count 统计各个类型的次数
    group2014 = data2014.withColumn("Grade", get_function_udf(data2014['Value'])).groupBy("Grade").count()
    group2015 = data2015.withColumn("Grade", get_function_udf(data2015['Value'])).groupBy("Grade").count()
    group2016 = data2016.withColumn("Grade", get_function_udf(data2016['Value'])).groupBy("Grade").count()

    # 查看各个类型在全年中的占比情况
    group2014.select("Grade","count",group2014['count']/data2014.count()).show()
    group2015.select("Grade","count",group2015['count']/data2015.count()).show()
    group2016.select("Grade","count",group2016['count']/data2016.count()).show()

    result2014 = group2014.select("Grade","count").withColumn("precent",group2014['count']/data2014.count() * 100)
    result2015 = group2015.select("Grade","count").withColumn("precent",group2015['count']/data2015.count() * 100)
    result2016 = group2016.select("Grade","count").withColumn("precent",group2016['count']/data2016.count() * 100)

    result2014.selectExpr("Grade as grade", "count", "precent").write.format("org.elasticsearch.spark.sql").option("es.nodes","hadoop01:9200").mode("overwrite").save("beijing_weather2014/pm")
    result2015.selectExpr("Grade as grade", "count", "precent").write.format("org.elasticsearch.spark.sql").option("es.nodes","hadoop01:9200").mode("overwrite").save("beijing_weather2015/pm")
    result2016.selectExpr("Grade as grade", "count", "precent").write.format("org.elasticsearch.spark.sql").option("es.nodes","hadoop01:9200").mode("overwrite").save("beijing_weather2016/pm")

    spark.stop()
5、将数据上传到hadoop hdfs上
5.1、启动hadoop
cd /opt/hadoop/sbin
./start-all.sh
5.2、在hadoop上创建目录
hadoop fs -mkdir -p /kongqizhiliang/
hadoop fs -ls /kongqizhiliang/

cd /opt/bigdatas/kongqizhiliang
hadoop fs -put Guangzhou* /kongqizhiliang/
6.将代码放到/opt/script目录下
![]()
7.到spark目录
cd $SPARK_HOME
cd bin
--yarn模式 :将任务提交到 yarn 上
./spark-submit --master yarn --name kongqizhiliang /opt/script/beijing_kongqizhiliang.py
7.使用SparkSQL将统计结果写入到ES中
使用pyspark 本地模式
./pyspark --master local[2] --jars /opt/spark/jars/elasticsearch-spark-20_2.11-7.2.0.jar
使用 spark-submit 执行文件
./spark-submit --master local[2] --jars /opt/spark/jars/elasticsearch-spark-20_2.11-7.2.0.jar /opt/script/kongqizhiliang02.py
删除索引:
curl -XDELETE ‘http://hadoop01:9200/beijing_weather2015’
curl -XDELETE ‘http://hadoop01:9200/beijing_weather2016’
curl -XDELETE ‘http://hadoop01:9200/beijing_weather2014’
