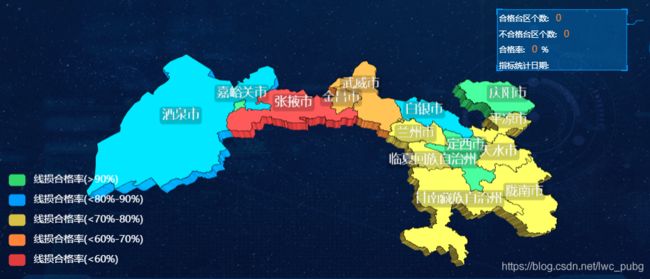
vue地图按区域数据不同显示相应的颜色
<template>
  <div style="height:100%;width:100%">
     <div id="chart_example"></div>
     <div class="mapTips">
       <div class="orgMsg"  v-for="(items,index) in orgMsg" :key="index">{
     {
     items.name}}:<span class="msgValue">{
     {
     items.value}}</span><span class="msgValueTip">{
     {
     items.tip}}</span></div>
     </div>
  </div>
</template>
<script>
import echarts from 'echarts'
import echartsgl from 'echarts-gl'
var cywc_zyq = require('@/assets/json/json.json')  // 引入geojson文件

export default {

  name: 'echartsMap',
  data () {

    return {

      msg: 'Welcome to Your Vue.js App',
      orgMsg:[
        {
     name:'合格台区个数',value:'0',tip:''},
        {
     name:'不合格台区个数',value:'0',tip:''},
        {
     name:'合格率',value:'0',tip:'%'},
        {
     name:'指标统计日期',value:this.nowDate,tip:''}
      ],
      mapkey:'',
      mapDataArr:[],
      nowDate:null,
      nowTime:null,
      timer: "",
      currentTime: new Date(),
      aData:null
    }
  },
  created() {

    this.timer = setInterval(this.getTime, 1000);
  },
  mounted () {

    this.getAreaData();
  },
  methods: {

    getTime(){

            let _this=this;
            const date = new Date();
            const year = date.getFullYear();
            const month = date.getMonth() + 1;
            const day = date.getDate();
            const hour= date.getHours();
            const minute = date.getMinutes();
            const second = date.getSeconds();
            const str = ''
            if(this.hour>12) {

                    this.hour -= 12;
                    this.str = " AM";
            }else{

                        this.str = " PM";
                      }
            this.month=check(month);
            this.day=check(day);
            this.hour=check(hour);
            this.minute=check(minute);
            this.second=check(second);
            function check(i){

                                          const num = (i<10)?("0"+i) : i;
                                          return num;
                                      }
          _this.nowDate = year + "年" + this.month + "月" + this.day+"日";
          _this.nowTime = this.hour + ":" + this.minute + ":" + this.second + this.str;
    },
    drawLine () {

      let this_ = this
      let myChart = echarts.init(document.getElementById('chart_example'));
      echarts.registerMap('xicheng', cywc_zyq, {
     })
      myChart.hideLoading()
      var option = {

        tooltip: {
     // 提示框
          trigger: 'item',
          formatter: function (params) {

            return params.name
          }
        },
          dataRange: {

                x: 'left',
                y: 'bottom',
                splitList: [
                    {
     start: 90,label:'线损合格率(>90%)'},
                    {
     start: 80, end: 90,label:'线损合格率(<80%-90%)'},
                    {
     start: 70, end: 80,label:'线损合格率(<70%-80%)'},
                    {
     start: 60, end: 70,label:'线损合格率(<60%-70%)'},
                    {
     end: 60,label:'线损合格率(<60%)'}
                ],
                color: ['#31D76B', '#009CFF', '#D7C046','#FF8439','#E03D3D'],
                textStyle:{

                  color:'white'
                }
            },
        series: [{

          type: 'map3D',
          name: 'map3D',
          map: 'xicheng',
          label: {

            [ default: false ]
            show: true,
            textStyle: {

              color: 'rgba(255,255,255,1)',
              fontSize: 15,
              opacity: 1,
              backgroundColor: 'rgba(0,0,0,0.2)'
            }
          },
          itemStyle: {

            color: 'rgba(95,158,160,0.5)',
            opacity: 1,
            borderWidth: 0.5,
            borderColor: '#000'
          },
          emphasis: {

            label: {

              show: true,
              textStyle: {

                color: '#fff',
                fontSize: 15
              }
            },
            // itemStyle高亮时的配置
            itemStyle: {

              // 高亮时地图板块颜色改变
              areaColor: '#66ffff'
            }
          },
          light: {

            // 场景主光源的设置,在 globe 组件中就是太阳光。
            main: {

              // 主光源的颜色。[ default: #fff ]
              color: '#fff',
              // 主光源的强度。[ default: 1 ]
              intensity: 1.2,
              // 主光源是否投射阴影。默认关闭。    开启阴影可以给场景带来更真实和有层次的光照效果。但是同时也会增加程序的运行开销。
              shadow: false,
              // 阴影的质量。可选'low', 'medium', 'high', 'ultra' [ default: 'medium' ]
              // shadowQuality: 'high',
              // 主光源绕 x 轴,即上下旋转的角度。配合 beta 控制光源的方向。[ default: 40 ]
              alpha: 55,
              // 主光源绕 y 轴,即左右旋转的角度。[ default: 40 ]
              beta: 10
            },
            // 全局的环境光设置。
            ambient: {

              // 环境光的颜色。[ default: #fff ]
              color: '#fff',
              // 环境光的强度。[ default: 0.2 ]
              intensity: 0.5
            }
          },
          // 用于鼠标的旋转,缩放等视角控制。
          viewControl: {

            // 投影方式,默认为透视投影'perspective',也支持设置为正交投影'orthographic'。
            projection: 'perspective',
            // 是否开启视角绕物体的自动旋转查看。[ default: false ]
            autoRotate: false,
            // 物体自传的方向。默认是 'cw' 也就是从上往下看是顺时针方向,也可以取 'ccw',既从上往下看为逆时针方向。
            autoRotateDirection: 'cw',
            // 物体自传的速度。单位为角度 / 秒,默认为10 ,也就是36秒转一圈。
            autoRotateSpeed: 10,
            // 在鼠标静止操作后恢复自动旋转的时间间隔。在开启 autoRotate 后有效。[ default: 3 ]
            autoRotateAfterStill: 3,
            // 鼠标进行旋转,缩放等操作时的迟滞因子,在大于等于 1 的时候鼠标在停止操作后,视角仍会因为一定的惯性继续运动(旋转和缩放)。[ default: 0.8 ]
            damping: 0,
            // 旋转操作的灵敏度,值越大越灵敏。支持使用数组分别设置横向和纵向的旋转灵敏度。默认为1, 设置为0后无法旋转。	rotateSensitivity: [1, 0]——只能横向旋转; rotateSensitivity: [0, 1]——只能纵向旋转。
            rotateSensitivity: 1,
            // 缩放操作的灵敏度,值越大越灵敏。默认为1,设置为0后无法缩放。
            zoomSensitivity: 1,
            // 平移操作的灵敏度,值越大越灵敏。默认为1,设置为0后无法平移。支持使用数组分别设置横向和纵向的平移灵敏度
            panSensitivity: 1,
            // 平移操作使用的鼠标按键,支持:'left' 鼠标左键(默认);'middle' 鼠标中键 ;'right' 鼠标右键(注意:如果设置为鼠标右键则会阻止默认的右键菜单。)
            panMouseButton: 'left',
            // 旋转操作使用的鼠标按键,支持:'left' 鼠标左键;'middle' 鼠标中键(默认);'right' 鼠标右键(注意:如果设置为鼠标右键则会阻止默认的右键菜单。)
            rotateMouseButton: 'left',

            // [ default: 100 ] 默认视角距离主体的距离,对于 grid3D 和 geo3D 等其它组件来说是距离中心原点的距离,对于 globe 来说是距离地球表面的距离。在 projection 为'perspective'的时候有效。
            distance: 65,
            // [ default: 40 ] 视角通过鼠标控制能拉近到主体的最小距离。在 projection 为'perspective'的时候有效。
            minDistance: 40,
            // [ default: 400 ] 视角通过鼠标控制能拉远到主体的最大距离。在 projection 为'perspective'的时候有效。
            maxDistance: 400,

            // 视角绕 x 轴,即上下旋转的角度。配合 beta 可以控制视角的方向。[ default: 40 ]
            alpha: 60,
            // 视角绕 y 轴,即左右旋转的角度。[ default: 0 ]
            beta: -30,
            // 上下旋转的最小 alpha 值。即视角能旋转到达最上面的角度。[ default: 5 ]
            minAlpha: -360,
            // 上下旋转的最大 alpha 值。即视角能旋转到达最下面的角度。[ default: 90 ]
            maxAlpha: 360,
            // 左右旋转的最小 beta 值。即视角能旋转到达最左的角度。[ default: -80 ]
            minBeta: -360,
            // 左右旋转的最大 beta 值。即视角能旋转到达最右的角度。[ default: 80 ]
            maxBeta: 360,

            // 视角中心点,旋转也会围绕这个中心点旋转,默认为[0,0,0]。
            center: [0, 0, 0],

            // 是否开启动画。[ default: true ]
            animation: true,
            // 过渡动画的时长。[ default: 1000 ]
            animationDurationUpdate: 1000,
            // 过渡动画的缓动效果。[ default: cubicInOut ]
            animationEasingUpdate: 'cubicInOut'
          },

          // 可对单个地图区域进行设置
          data: [
            // 所对应的地图区域的名称
            {
     name: '酒泉市',value: 83,key:6230},
            {
     name: '嘉峪关市',value: 91,key:6202},
            {
     name: '张掖市',value: 50,key:6207},
            {
     name: '金昌市',value: 65,key:6203},
            {
     name: '武威市',value: 65,key:6206},
            {
     name: '白银市',value: 82,key:6204},
            {
     name: '兰州市',value: 72,key:6201},
            {
     name: '定西市',value: 93,key:6211},
            {
     name: '临夏回族自治州',value: 72,key:6229},
            {
     name: '甘南藏族自治州',value: 72,key:6230},
            {
     name: '陇南市',value: 72,key:6212},
            {
     name: '天水市',value: 72,key:6205},
            {
     name: '平凉市',value: 72,key:6208},
            {
     name: '庆阳市',value: 91,key:6210},
          ]
        }]
      }

      // 设置图表实例的配置项以及数据,万能接口,所有参数和数据的修改都可以通过setOption完成,ECharts 会合并新的参数和数据,然后刷新图表。
      myChart.setOption(option)
      let _this=this
      //   myChart.setOption(option);
      myChart.on('click', function (param) {

        _this.mapkey=param.data.key
        for(let i=0;i<_this.mapDataArr.length;i++){

          if(_this.mapkey ==_this.mapDataArr[i].areaId){

            let isOk=0;
            let isBad=0;
            let passRate=0
            if(_this.mapDataArr[i].is_Qualified=='1'){

                isBad=_this.mapDataArr[i].lossCount
            }else{

              isOk=_this.mapDataArr[i].lossCount
            }
            passRate=Number(isOk)/(Number(isOk)+Number(isBad));
            _this.orgMsg=[
                {
     name:'合格台区个数',value:isOk,tip:''},
                {
     name:'不合格台区个数',value:isBad,tip:''},
                {
     name:'合格率',value:passRate*100,tip:'%'},
                {
     name:'指标统计日期',value:_this.nowDate,tip:''}
                  ]
          }
        }

      })

      // 建议加上以下这一行代码,不加的效果图如下(当浏览器窗口缩小的时候)。超过了div的界限(红色边框)
      window.addEventListener('resize', function () {

        myChart.resize()
      })
    },
    getAreaData(){

          let _this = this
          let body = {
     }
          _this.aData = new Date();
          body.time=_this.aData.getFullYear() + "-" + (_this.aData.getMonth() + 1) + "-" + _this.aData.getDate();;
          _this.$http.post(_this.$api.homeApi.getHomeAreaLossTotal, body).then(function (res) {

            if (res.code === '00000') {

                  _this.mapDataArr=res.data.areaLossTotal;
            }
          }).then(res=>{

           _this.drawLine();
          }).catch(function () {

            console.log('请求失败')
          })
    }
  },
  beforeDestroy() {

    if (this.timer) {

      clearInterval(this.timer); // 在Vue实例销毁前,清除定时器
    }
  },
}
</script>

<style scoped>
  #chart_example{

    width: 100%;
    height: 100%;
    margin: 0 auto;
  }
  .mapTips{

    height: 12%;
    width: 23%;
    background:url('/static/images/home/[email protected]') no-repeat;
    background-size:100% 100%;
    position: absolute;
    top: 0;
    right: 0;
  }
  .orgMsg{

    width: 100%;
    height: 25%;
    font-size:6px;
    font-family:Microsoft YaHei;
    font-weight:400;
    color:rgba(255,255,255,1);
    text-align: left;
    box-sizing: border-box;
    padding: 3px;
  }
  .msgValue{

    font-size:11px;
    font-family:Microsoft YaHei;
    font-weight:400;
    color:rgba(255,132,57,1);
    margin-left: 5%;
  }
  .msgValueTip{

   margin-left: 5px;
  }
</style>
已经封装为一个组件 。
drawLine里面的data 则是不同地区数据的格式;
export default中的data 则是表达显示不同数据的区段
