uni-app 使用echart开发小程序遇到的坑
最近一直在做小程序项目,导入eachat很坑,网上教程搜索一堆,但是基本没效果,所以坑了很久,才弄出来,真实有效的dome,
按照 uni-app中使用Echarts的实践总结 的步骤引用echarts
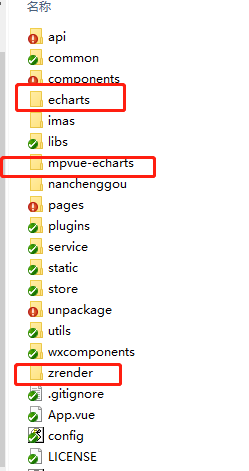
先在uni-app 创建一个文件夹,然后在命令行管理中进入到该目录下,执行
npm i
然后安装包
npm install echarts mpvue-echarts --save
<template>
    <div class="container">
        <mpvue-echarts ref="pieChart" :echarts="echarts" :onInit="onInit" />
    </div>
</template>

<script>
    import * as echarts from 'echarts'
    import mpvueEcharts from 'mpvue-echarts'

    function initChart(canvas, width, height) {

        debugger
        const chart = echarts.init(canvas, null, {

            width: width,
            height: height
        })
        canvas.setChart(chart)

        var option = {

        title: {

            text: '某站点用户访问来源',
            subtext: '纯属虚构',
            x: 'center'
        },
        tooltip: {

            trigger: 'item',
            formatter: "{a} {b} : {c} ({d}%)"
        },
        legend: {

            orient: 'vertical',
            bottom: '10%',
            data: ['直接访问', '邮件营销', '联盟广告', '视频广告', '搜索引擎']
        },
        series: [{

            name: '访问来源',
            type: 'pie',
            radius: '55%',
            center: ['50%', '40%'],
            data: [{

                    value: 335,
                    name: '直接访问'
                },
                {

                    value: 310,
                    name: '邮件营销'
                },
                {

                    value: 234,
                    name: '联盟广告'
                },
                {

                    value: 135,
                    name: '视频广告'
                },
                {

                    value: 1548,
                    name: '搜索引擎'
                }
            ],
            itemStyle: {

                emphasis: {

                    shadowBlur: 10,
                    shadowOffsetX: 0,
                    shadowColor: 'rgba(0, 0, 0, 0.5)'
                }
            }
        }]
    };


        chart.setOption(option)
        return chart
    }

    export default {

        data() {

            return {

                echarts,
                onInit: initChart
            }
        },

        components: {

            mpvueEcharts
        }
    }
</script>

<style>
    .container {

        flex: 1;
    }
</style>
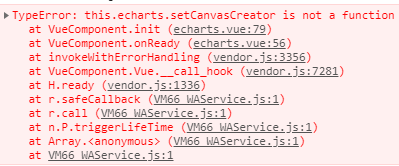
第一个坑来了

报错了,是因为封装的mpvue-echarts 有点问题,怎么解决呢?

点击这个echart.vue把内容替换成
<template>
	<canvas v-if="canvasId" class="ec-canvas" :id="canvasId" :canvasId="canvasId" @touchstart="touchStart" @touchmove="touchMove" @touchend="touchEnd" @error="error"></canvas>
</template>

<script>
import WxCanvas from './wx-canvas';
export default {

	props: {

		canvasId: {

			type: String,
			default: 'ec-canvas'
		},
		lazyLoad: {

			type: Boolean,
			default: false
		},
		disableTouch: {

			type: Boolean,
			default: false
		},
		throttleTouch: {

			type: Boolean,
			default: false
		}
	},
	// #ifdef H5
	mounted() {

		if (!this.lazyLoad) this.init();
	},
	// #endif
	// #ifndef H5
	onReady() {

		if (!this.lazyLoad) this.init();
	},
	// #endif
	methods: {

		setChart(chart){

			this.chart = chart
		},
		init() {

			const {
      canvasId } = this;
			this.ctx = wx.createCanvasContext(canvasId, this);
			this.canvas = new WxCanvas(this.ctx, canvasId);
			const query = wx.createSelectorQuery().in(this);
			query
				.select(`#${
       canvasId}`)
				.boundingClientRect(res => {

					if (!res) {

						setTimeout(() => this.init(), 50);
						return;
					}
					this.$emit('onInit', {

						  canvas: this.canvas,
						width: res.width,
						height: res.height
					});
				})
				.exec();
		},
		canvasToTempFilePath(opt) {

			const {
      canvasId } = this;
			this.ctx.draw(true, () => {

				wx.canvasToTempFilePath({

					canvasId,
					...opt
				});
			});
		},
		touchStart(e) {

			const {
      disableTouch, chart } = this;
			if (disableTouch || !chart || !e.mp.touches.length) return;
			const touch = e.mp.touches[0];
			chart._zr.handler.dispatch('mousedown', {

				zrX: touch.x,
				zrY: touch.y
			});
			chart._zr.handler.dispatch('mousemove', {

				zrX: touch.x,
				zrY: touch.y
			});
		},
		touchMove(e) {

			const {
      disableTouch, throttleTouch, chart, lastMoveTime } = this;
			if (disableTouch || !chart || !e.mp.touches.length) return;
			if (throttleTouch) {

				const currMoveTime = Date.now();
				if (currMoveTime - lastMoveTime < 240) return;
				this.lastMoveTime = currMoveTime;
			}
			const touch = e.mp.touches[0];
			chart._zr.handler.dispatch('mousemove', {

				zrX: touch.x,
				zrY: touch.y
			});
		},
		touchEnd(e) {

			const {
      disableTouch, chart } = this;
			if (disableTouch || !chart) return;
			const touch = e.mp.changedTouches ? e.mp.changedTouches[0] : {
     };
			chart._zr.handler.dispatch('mouseup', {

				zrX: touch.x,
				zrY: touch.y
			});
			chart._zr.handler.dispatch('click', {

				zrX: touch.x,
				zrY: touch.y
			});
		}
	}
};
</script>

<style scoped>
.ec-canvas {

	width: 100%;
	height: 100%;
	flex: 1;
}
</style>
替换成这个。
page/index/index.vue里面 的dome 改成
<template>
    <view class="container">
        <mpvue-echarts ref="pieChart" :echarts="echarts" @onInit="initChart" />
    </view>
</template>

<script>
    import * as echarts from 'echarts'
    import mpvueEcharts from 'mpvue-echarts'

    export default {

        data() {

            return {

                echarts
            }
        },
        components: {

            mpvueEcharts
        },
        methods: {

            initChart(e) {

                let {

                    canvas,
                    width,
                    height
                } = e;
                width = width - 20;
                //let canvas = this.$refs.pieChart.canvas;
                echarts.setCanvasCreator(() => canvas);
                const chart = echarts.init(canvas, null, {

                    width: width,
                    height: height
                })

                canvas.setChart(chart)
                var option = {

                    title: {

                        text: '某站点用户访问来源',
                        subtext: '纯属虚构',
                        x: 'center'
                    },
                    tooltip: {

                        trigger: 'item',
                        formatter: "{a} {b} : {c} ({d}%)"
                    },
                    legend: {

                        orient: 'vertical',
                        bottom: '10%',
                        data: ['直接访问', '邮件营销', '联盟广告', '视频广告', '搜索引擎']
                    },
                    series: [{

                        name: '访问来源',
                        type: 'pie',
                        radius: '55%',
                        center: ['50%', '40%'],
                        data: [{

                                value: 335,
                                name: '直接访问'
                            },
                            {

                                value: 310,
                                name: '邮件营销'
                            },
                            {

                                value: 234,
                                name: '联盟广告'
                            },
                            {

                                value: 135,
                                name: '视频广告'
                            },
                            {

                                value: 1548,
                                name: '搜索引擎'
                            }
                        ],
                        itemStyle: {

                            emphasis: {

                                shadowBlur: 10,
                                shadowOffsetX: 0,
                                shadowColor: 'rgba(0, 0, 0, 0.5)'
                            }
                        }
                    }]
                };

                chart.setOption(option)
                this.$refs.pieChart.setChart(chart);
                //return chart
            }
        }
    }
</script>

<style>
    page,
    .container {

        height: 100%;
    }

    .container {

        padding: 0 10px;
    }
</style>
就可以成功显示了,以上,这是借用简书一位老哥的解决思路感谢这老哥https://www.jianshu.com/p/5537e5053dc1 附上原文链接
这个时候还有一个坑,打包面积过大,打包不了,
这时候
本项目默认提供的 ECharts 文件是最新版本的包含所有组件文件,为了便于开发,提供的是未压缩的版本。远程调试或预览可以下载 echarts.min.js 压缩版本。
发布时,如果对文件大小要求更高,可以在 ECharts 在线定制网页下载仅包含必要组件的包,并且选择压缩。
定制按需选择后得到echarts.min.js
将echarts.min.js文件复制到echarts目录下。
并修改引用:
   import * as echarts from 'echarts/echarts.min.js'
    import mpvueEcharts from 'mpvue-echarts/src/echarts.vue'
大功告成-以上
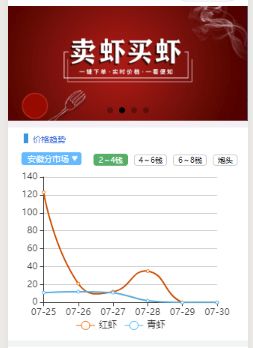
echart 里面
grid 为图标所在元素的位置 可以用百分比 可以用 top,bottom等,也可以 直接用 8 这样的px单位
legend 里面 也可以用 “top" bottom 等控制介绍栏目的位置
color:[’#ff6600’,’#2db7f5’], 来固定介绍栏目的颜色
series 为元素数据
xAxis:为X轴的标刻度
