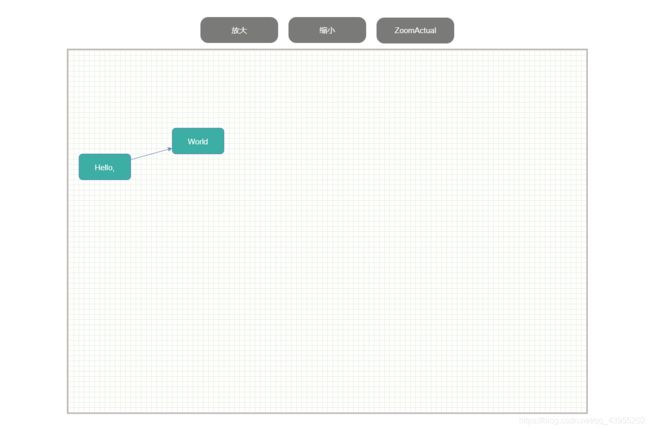
Mxgraph 使用教程(6):给mxgraph图添加操作工具按钮
上文我们讲解了mxgraph图如何设置样式,接下来我们给我们的mxgraph图添加一些操作工具吧
1.准备工作
2.添加操作按钮
 <!-- 创建操作按钮放置容器 -->
    <div id="methods">
      <div ref="buttons"></div>
    </div>
refs选中的元素为生成的button所在的父级
//定义操作按钮

      //放大节点
      this.$refs.buttons.appendChild(
        mxUtils.button('ZoomIn', function() {

          graph.zoomIn()
        })
      )

      //缩小节点
      this.$refs.buttons.appendChild(
        mxUtils.button('ZoomOut', function() {

          graph.zoomOut()
        })
      )

      //还原节点
      this.$refs.buttons.appendChild(
        mxUtils.button('ZoomActual', function() {

          graph.zoomActual()
        })
      )
全部代码:
<template>
  <div>
     <!-- 创建操作按钮放置容器 -->
    <div id="methods">
      <div ref="buttons"></div>
    </div>


    <div id="graphContainer"></div>


  </div>
</template>

<script>
import mxgraph from "./mxgraph";
const {

  mxGraph,
  mxClient,
  mxCodec,
  mxUtils,
  mxConstants,
  mxPerimeter,
} = mxgraph;

export default {

  mounted() {

    if (!mxClient.isBrowserSupported()) {

      // 判断是否支持mxgraph
      mxUtils.error("Browser is not supported!", 200, false);
    } else {

      // 在容器中创建图表
      let container = document.getElementById("graphContainer");

      var graph = new mxGraph(container);

      // 生成 Hello world!
      var parent = graph.getDefaultParent();
      graph.getModel().beginUpdate();

      //定义节点样式
      var nodeStyle = {
     };
      nodeStyle[mxConstants.STYLE_FILLCOLOR] = "#3CAEA3";
      nodeStyle[mxConstants.STYLE_FONTSIZE] = 15;
      nodeStyle[mxConstants.STYLE_STROKE_COLOR] = "white";
      nodeStyle[mxConstants.STYLE_FONTCOLOR] = "white";
      nodeStyle[mxConstants.STYLE_ROUNDED] = 1;

      // 把定义好的样式object push到stylesheet
      graph.getStylesheet().putCellStyle("nodeStyle", nodeStyle)


      try {

        var v1 = graph.insertVertex(
          parent,
          null,
          "Hello,",
          20,
          200,
          100,
          50,
          'nodeStyle'
        );
        var v2 = graph.insertVertex(
          parent,
          null,
          "World",
          200,
          150,
          100,
          50,
          'nodeStyle'
        );
        graph.insertEdge(parent, null, "", v1, v2);
      } finally {

        // Updates the display
        graph.getModel().endUpdate();
      }
    }

     //定义操作按钮

      //放大节点
      this.$refs.buttons.appendChild(
        mxUtils.button('ZoomIn', function() {

          graph.zoomIn()
        })
      )

      //缩小节点
      this.$refs.buttons.appendChild(
        mxUtils.button('ZoomOut', function() {

          graph.zoomOut()
        })
      )

      //还原节点
      this.$refs.buttons.appendChild(
        mxUtils.button('ZoomActual', function() {

          graph.zoomActual()
        })
      )

  },

};
</script>

<style>
#graphContainer {

  width: 1000px;
  height: 700px;
  border: 3px solid rgb(194, 185, 185);
  background-image: url("../assets/grid.gif");
  margin: auto;
}

button{

  width: 150px;
  height: 50px;
  background: rgb(122, 122, 121);
  color: white;
  font-size: 15px;
  margin: 10px;
  outline: none;
  border: none;
  border-radius: 15px;
}
</style>
更多操作按钮:
 //选中所有
      this.$refs.btn1.appendChild(
        mxUtils.button('Select all', function() {

          graph.selectAll()
        })
      )

      //选择一个
      this.$refs.btn2.appendChild(
        mxUtils.button('Choose one', function() {

          graph.selectCell()
        })
      )

      //取消选择
      this.$refs.btn3.appendChild(
        mxUtils.button('Deselect', function() {

          var cells = graph.getSelectionCells()
          graph.removeSelectionCells(cells)
        })
      )

      //删除所选
      this.$refs.btn4.appendChild(
        mxUtils.button('Delete', function() {

          var cells = graph.getSelectionCells()
          graph.removeCells(cells)
        })
      )

      //放大节点
      this.$refs.btn5.appendChild(
        mxUtils.button('ZoomIn', function() {

          graph.zoomIn()
        })
      )

      //缩小节点
      this.$refs.btn6.appendChild(
        mxUtils.button('ZoomOut', function() {

          graph.zoomOut()
        })
      )

      //还原节点
      this.$refs.btn7.appendChild(
        mxUtils.button('ZoomActual', function() {

          graph.zoomActual()
        })
      )

      //清空画板
      this.$refs.btn8.appendChild(
        mxUtils.button('Clear', function() {

          graph.removeCells(graph.getChildVertices(graph.getDefaultParent()))
        })
      )

