python 绘图多图控制 (利用matplotlib)
之前习惯matlab画图,但因为最近这个趋势,还是得逐步将代码都换成python保险一些
1. 多个画图窗口
在matlab中,可以使用
fig1=figure(1)
plot(x,y)
fig2=figure(2)
plot(x2,y2)

print(fig1,fformat,figurename1,resolution)
print(fig2,fformat,figurename1,resolution)
来控制画图与输出。
在python中,可以分别show()
fig1= plt.figure(1)
plt.plot....

fig2= plt.figure(2)
plt.plot....

fig1.savefig(filen1)
fig2.savefig(filen2)
plt.show()
2. 一张图中多个子图
2.1 采用subplots
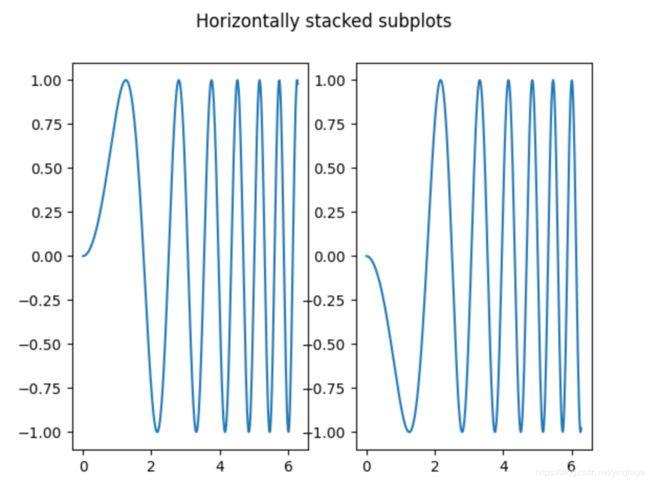
如官网上的案例:
fig, (ax1, ax2) = plt.subplots(1, 2)
fig.suptitle('Horizontally stacked subplots')
ax1.plot(x, y)
ax2.plot(x, -y)
多行多列的组合
fig, ((ax1, ax2), (ax3, ax4)) = plt.subplots(2, 2)
fig.suptitle('Sharing x per column, y per row')
ax1.plot(x, y)
ax2.plot(x, y**2, 'tab:orange')
ax3.plot(x, -y, 'tab:green')
ax4.plot(x, -y**2, 'tab:red')

for ax in fig.get_axes():
    ax.label_outer()
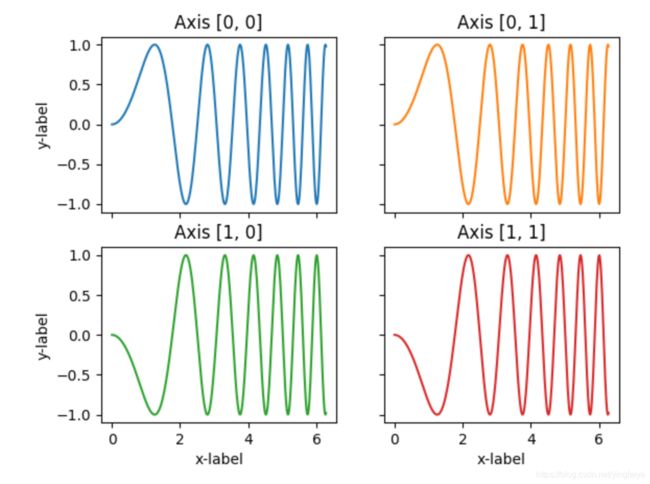
fig, axs = plt.subplots(2, 2)
axs[0, 0].plot(x, y)
axs[0, 0].set_title('Axis [0, 0]')
axs[0, 1].plot(x, y, 'tab:orange')
axs[0, 1].set_title('Axis [0, 1]')
axs[1, 0].plot(x, -y, 'tab:green')
axs[1, 0].set_title('Axis [1, 0]')
axs[1, 1].plot(x, -y, 'tab:red')
axs[1, 1].set_title('Axis [1, 1]')

for ax in axs.flat:
    ax.set(xlabel='x-label', ylabel='y-label')

# Hide x labels and tick labels for top plots and y ticks for right plots.
for ax in axs.flat:
    ax.label_outer()
2.2 还可以用subplot
和subplots 的区别是每个子图前需要用subplot声明,应该说更明确更好用一些。(还可以控制坐标之类的)
# first you have to make the figure

fig2=plt.figure(2,figsize=(6,4))
fig2.subplots_adjust(left=0.1,right=0.9,bottom=0.05,top=0.95,wspace=0.2,hspace=0.2)
ax1=plt.subplot(2,2,1)
ax1.plot(x, y)
ax1=plt.subplot(2,2,2)
ax1.plot(x, y)
ax1=plt.subplot(2,2,3)
ax1.plot(x, y)
ax1=plt.subplot(2,2,4)
ax1.plot(x, y)
三个数字,分别代表总行总列以及目前子图的序号,其中逗号可以直接省略
subplots_adjust是用来控制子图间的距离
3 不一样大小的子图
图片总大小可以用
f1=plt.figure(figize=(20,10))
#or
f2,ax=plt.subplots(2,1,figsize=(20,10))
3.1 利用axes.()
但是如果要控制子图大小和位置的话。。。
在matlab 里,我一般用
set(gcf,‘unit’,‘centimeters’,‘position’,[figuresize])来控制整图大小
subplot(‘position’,[a,b,c,d])来控制子图大小与位置,a为x起始位置,b为y起始位置,c,d为长宽,都是按比例。
这个思路可以通过以下代码来实现:
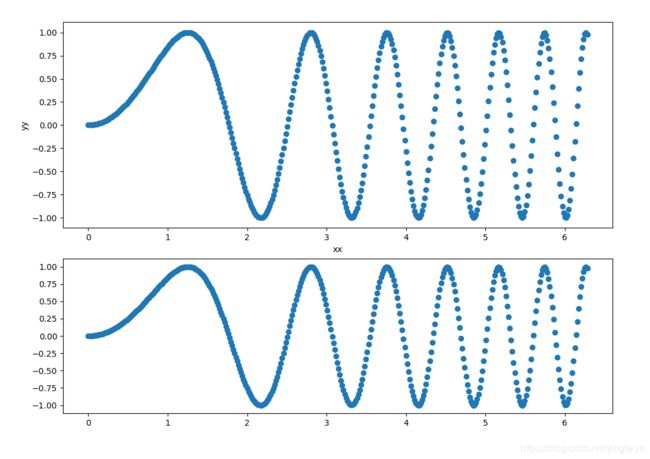
fig3=plt.figure(3,figsize=(10,5))
left,width=0.13,0.77
bottom,height1,height2=0.11,0.3,0.4
bottom2 = bottom+height1+0.04
fig1pos= [left,bottom,width,height1]
fig2pos= [left,bottom2,width,height2]


ax1=plt.axes(fig1pos)
ax2=plt.axes(fig2pos)
ax1.scatter(x, y)
ax2.scatter(x, y)
ax2.set(xlabel='xx')
ax2.set(ylabel='yy')

plt.show()
如图:

关键就在于子图先用plt.axes([position])来确定位置
3.2 利用GridSpec.()
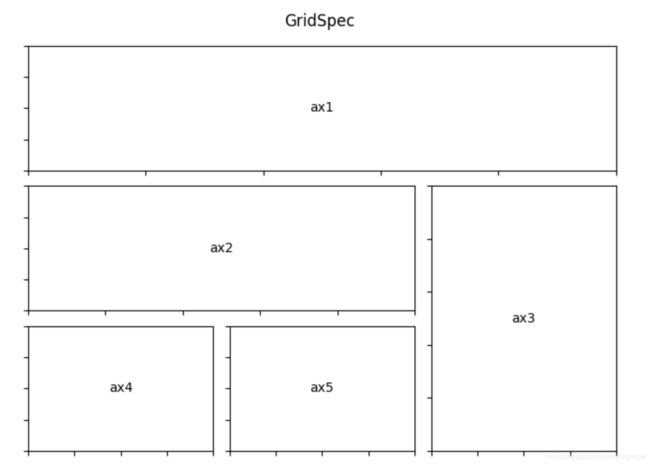
另一种方法是通过GridSpec来进行多图排版,思路就是把图片网格化,不同网格组合来进行画图,和搭积木一样。我暂时还不用,可参考一些模板,如
import matplotlib.pyplot as plt
from matplotlib.gridspec import GridSpec


def format_axes(fig):
    for i, ax in enumerate(fig.axes):
        ax.text(0.5, 0.5, "ax%d" % (i+1), va="center", ha="center")
        ax.tick_params(labelbottom=False, labelleft=False)

fig = plt.figure(constrained_layout=True)

gs = GridSpec(3, 3, figure=fig)
ax1 = fig.add_subplot(gs[0, :])
# identical to ax1 = plt.subplot(gs.new_subplotspec((0, 0), colspan=3))
ax2 = fig.add_subplot(gs[1, :-1])
ax3 = fig.add_subplot(gs[1:, -1])
ax4 = fig.add_subplot(gs[-1, 0])
ax5 = fig.add_subplot(gs[-1, -2])

fig.suptitle("GridSpec")
format_axes(fig)

plt.show()


