基于Telegraf+Influxdb+Grafana的监控平台介绍
最近在做大数据监控平台的方案调研,做了一些开源解决方案的尝试,今天分享一下基于Telegraf+InfluxDB+Grafana的监控平台整体部署过程。文章开始会简单介绍下 TICK 技术栈,接下来就是本次方案各个组件的安装部署了。希望对正在调研大数据监控平台或对监控系统感兴趣的同学有所帮助。
我们知道这种监控平台的数据特征一般都是时间序列数据(简称 时序数据),那么相应的这些数据最好是存储在时序数据库中,目前主流的时序数据库有InfluxDB、OpenTSDB、Graphite、TimescaleDB等。其中,InfluxDB是目前监控领域使用较多的时序数据库,并且基于InfluxDB有一套完善的开源解决方案 —— TICK Stack,如下图所示:
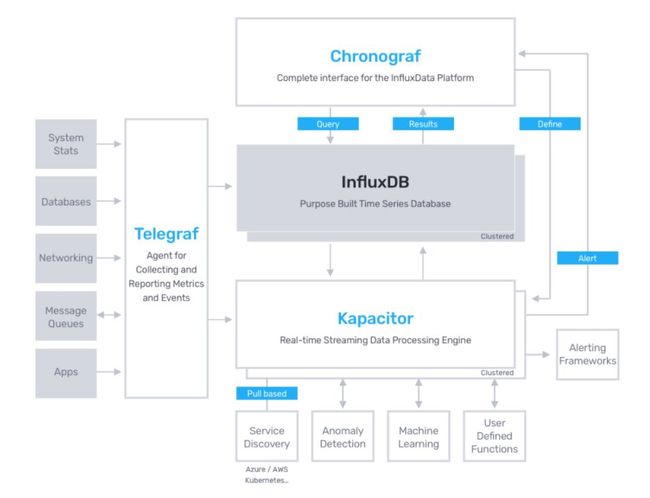
TICK Stack 是 InfluxData 公司提供的包括采集、存储、展示及监控告警在内的一体化解决方案,包含以下 4 个核心组件:
-
Telegraf:Time-Series Data Collector
-
InfluxDB:Time-Series Data Storage
-
Chronograf:Time-Series Data Visualization
-
Kapacitor:Time-Series Data Processing
今天我们选用 TICK Stack 中的 Telegraf 与 InfluxDB,配合另一个常用的数据可视化组件 Grafana,即前文所说的 Telegraf+InfluxDB+Grafana,实现对我们大数据平台的基础指标监控,包括但不限于CPU/Mem/Net/Disk/Diskio等。接下来主要介绍下各个组件的安装部署,请阅读下文。
一、InfluxDB
InfluxDB是目前IoT监控、DevOps监控等领域最主流的开源时序数据库,属于TICK Stack的核心组件。
优点:Go语言编写,没有任何第三方依赖。
1 安装influxdb
# wget https://dl.influxdata.com/influxdb/releases/influxdb-1.7.7.x86_64.rpm
# yum install -y influxdb-1.7.7.x86_64.rpm
2 启动influxdb
# systemctl start influxdb3 操作influxdb
下面演示创建一个名为“telegraf”的数据库,及名为“telegraf”的普通用户、“admin”的管理员用户:
# influx
Connected to http://localhost:8086 version 1.7.7
InfluxDB shell version: 1.7.7
> create database telegraf
> show databases
name: databases
name
----
_internal
telegraf
> create user "admin" with password 'admin' with all privileges
> create user "telegraf" with password 'telegraf'
> show users;
user     admin
----     -----
telegraf false
admin    true
> exit
4 查看influxdb配置
# more /etc/influxdb/influxdb.conf
...
[data]
  # The directory where the TSM storage engine stores TSM files.
  dir = "/var/lib/influxdb/data"


  # The directory where the TSM storage engine stores WAL files.
  wal-dir = "/var/lib/influxdb/wal"

...
二、Telegraf
Telegraf 是一个插件驱动的轻量级数据采集工具,用于收集系统和服务的各项指标。支持多种输入与输出插件,其中输入端支持直接获取操作系统的各项指标数据,从第三方API获取指标数据,甚至可以通过statsd和Kafka获取指标数据;输出端可以将采集的指标发送到各种数据存储,服务或消息队列中,支持InfluxDB,Graphite,OpenTSDB,Datadog,Librato,Kafka,MQTT等。
优点:Go语言编写,没有任何第三方依赖。
1 安装Telegraf
# wget https://dl.influxdata.com/telegraf/releases/telegraf-1.11.2-1.x86_64.rpm
# yum install -y telegraf-1.11.2-1.x86_64.rpm
2 配置Telegraf,这里修改outputs.influxdb的配置项
# vi /etc/telegraf/telegraf.conf
[[outputs.influxdb]]
  ## The full HTTP or UDP URL for your InfluxDB instance.
  ##
  ## Multiple URLs can be specified for a single cluster, only ONE of the
  ## urls will be written to each interval.
  # urls = ["unix:///var/run/influxdb.sock"]
  # urls = ["udp://127.0.0.1:8089"]
  urls = ["http://127.0.0.1:8086"]

  ## The target database for metrics; will be created as needed.
  ## For UDP url endpoint database needs to be configured on server side.
  database = "telegraf"

  ## The value of this tag will be used to determine the database.  If this
  ## tag is not set the 'database' option is used as the default.
  # database_tag = ""

  ## If true, no CREATE DATABASE queries will be sent.  Set to true when using
  ## Telegraf with a user without permissions to create databases or when the
  ## database already exists.
  # skip_database_creation = false

  ## Name of existing retention policy to write to.  Empty string writes to
  ## the default retention policy.  Only takes effect when using HTTP.
  # retention_policy = ""

  ## Write consistency (clusters only), can be: "any", "one", "quorum", "all".
  ## Only takes effect when using HTTP.
  # write_consistency = "any"

  ## Timeout for HTTP messages.
  timeout = "5s"

  ## HTTP Basic Auth
  username = "telegraf"
  password = "telegraf"
3 启动Telegraf
# systemctl start telegraf4 查看influxdb数据
# influx
> use telegraf
Using database telegraf
> show measurements
name: measurements
name
----
cpu
disk
diskio
kernel
mem
processes
swap
system
> exit
注意:influxdb 自1.2版本之后关闭了自带的 web 界面,安装之前的方式访问 web 界面将会报 "404 page not found",如果想用 web 界面访问influxdb,建议使用第三方工具,或者使用低版本influxdb的web界面访问。
三、Grafana
Grafana是目前比较流行的开源可视化组件,支持多种数据源,包括InfluxDB、OpenTSDB、Graphite、Prometheus、Elasticsearch等主流的时序数据库,以及MySQL、PostgreSQL等关系数据库等。
优点:Go语言编写,自带用户管理、告警等功能。
1 安装Grafana
# wget https://dl.grafana.com/oss/release/grafana-6.2.5-1.x86_64.rpm
# yum install -y grafana-6.2.5-1.x86_64.rpm
2 启动Grafana
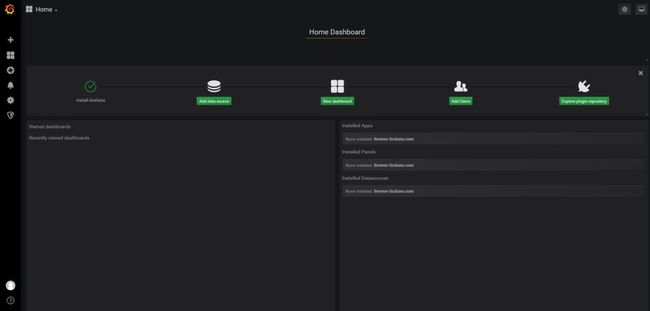
# systemctl start grafana-server3 访问Grafana
Grafana的默认http端口为3000,默认管理员用户密码为admin/admin,因此访问Grafana只需访问 http://IP:3000 即可,初始访问的时候会提示修改密码。首页如下:

4 查看Grafana配置
# more /etc/grafana/grafana.ini...
[paths]
# Path to where grafana can store temp files, sessions, and the sqlite3 db (if that is used)
;data = /var/lib/grafana
# Temporary files in `data` directory older than given duration will be removed
;temp_data_lifetime = 24h
# Directory where grafana can store logs
;logs = /var/log/grafana
...
# The http port to use
;http_port = 3000
...
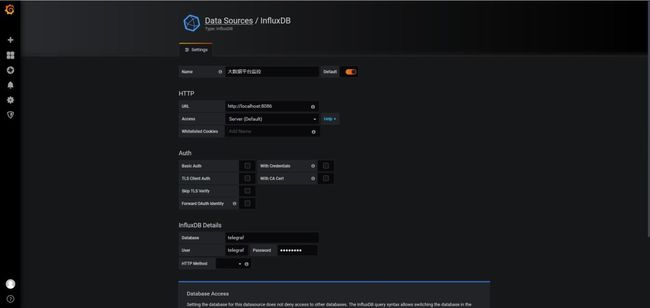
5 界面配置Grafana访问influxdb
进入Grafana界面后,首先是添加数据源:Data Sources --> Add data source,这里选择influxdb作为数据源;然后是新建可视化面板:Dashboards --> Manage --> New dashboard,简单配置展示项后数据就可以展示出来了。页面操作比较简单,具体细节不多赘述,自行进一步熟悉Grafana界面即可。
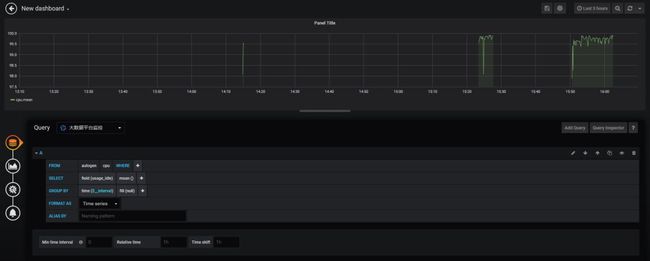
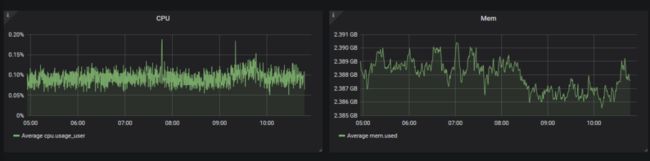
至此,我们演示了相关组件的安装部署与基本使用,成功展示了采集的指标数据。本文介绍了 TICK Stack,以及基于 Telegraf+InfluxDB+Grafana的监控平台搭建。后续更多的大数据监控运维分享请关注本公众号。
往期推荐
1、HBase最佳实践 | 聊聊HBase核心配置参数
2、Apache Hudi:剑指数据湖的增量处理框架
3、Hadoop社区比 Ozone 更重要的事情
4、MapReduce Shuffle 和 Spark Shuffle 结业篇