python机器学习ch02
last madified by xiaoyao
个人主页
Python 机器学习
Chapter 2 - Training Machine Learning Algorithms for Classification
训练机器学习算法从而实现分类
Note that the optional watermark extension is a small IPython notebook plugin that I developed to make the code reproducible. You can just skip the following line(s).
%load_ext watermark
%watermark -a "Sebastian Raschka" -u -d -p numpy,pandas,matplotlib
Sebastian Raschka
last updated: 2019-12-04

numpy 1.17.4
pandas 0.25.3
matplotlib 3.1.0
The use of watermark is optional. You can install this Jupyter extension via
conda install watermark -c conda-forge
or
pip install watermark
For more information, please see: https://github.com/rasbt/watermark.
Overview
- Artificial neurons – a brief glimpse into the early history of machine learning
- The formal definition of an artificial neuron
- The perceptron learning rule
- Implementing a perceptron learning algorithm in Python
- An object-oriented perceptron API
- Training a perceptron model on the Iris dataset
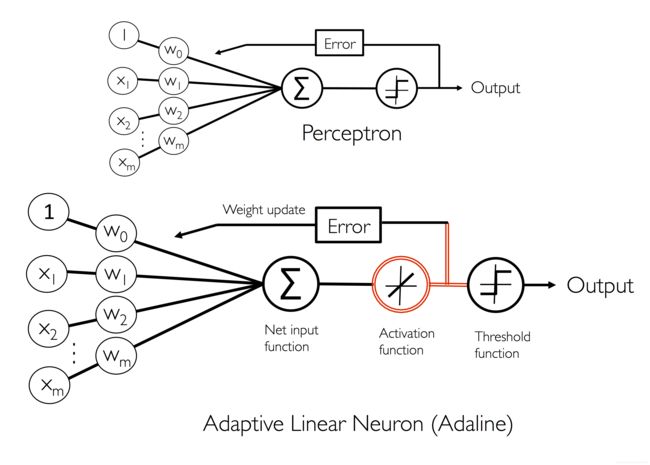
- Adaptive linear neurons and the convergence of learning
- Minimizing cost functions with gradient descent
- Implementing an Adaptive Linear Neuron in Python
- Improving gradient descent through feature scaling
- Large scale machine learning and stochastic gradient descent
- Summary
from IPython.display import Image
Artificial neurons - a brief glimpse into the early history of machine learning
人工神经元,简要回顾一下机器学习的早期历史
Image(filename='./images/02_01.png', width=500)
%pwd
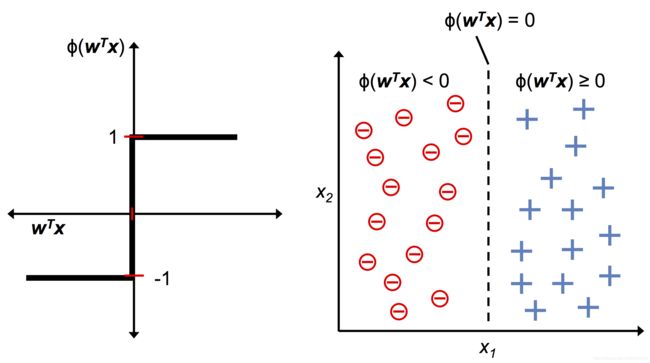
The formal definition of an artificial neuron
一个人工神经元的正式定义
Image(filename='./images/02_02.png', width=500)
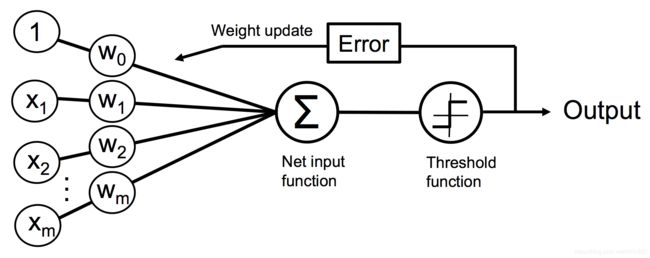
The perceptron learning rule
感知机的学习规则
Image(filename='./images/02_03.png', width=600)
Image(filename='./images/02_04.png', width=600)
Implementing a perceptron learning algorithm in Python
使用python实现一个感知机学习算法
An object-oriented perceptron API
一个面向对象的感知器API
import numpy as np


class Perceptron(object):
    """Perceptron classifier.

    Parameters
    ------------
    eta : float
      Learning rate (between 0.0 and 1.0)
    n_iter : int
      Passes over the training dataset.
    random_state : int
      Random number generator seed for random weight
      initialization.

    Attributes
    -----------
    w_ : 1d-array
      Weights after fitting.
    errors_ : list
      Number of misclassifications (updates) in each epoch.

    """
    def __init__(self, eta=0.01, n_iter=50, random_state=1):
        self.eta = eta
        self.n_iter = n_iter
        self.random_state = random_state

    def fit(self, X, y):
        """Fit training data.

        Parameters
        ----------
        X : {array-like}, shape = [n_examples, n_features]
          Training vectors, where n_examples is the number of examples and
          n_features is the number of features.
        y : array-like, shape = [n_examples]
          Target values.

        Returns
        -------
        self : object

        """
        rgen = np.random.RandomState(self.random_state)
        self.w_ = rgen.normal(loc=0.0, scale=0.01, size=1 + X.shape[1])
        self.errors_ = []

        for _ in range(self.n_iter):
            errors = 0
            for xi, target in zip(X, y):
                update = self.eta * (target - self.predict(xi))
                self.w_[1:] += update * xi
                self.w_[0] += update
                errors += int(update != 0.0)
            self.errors_.append(errors)
        return self

    def net_input(self, X):
        """Calculate net input"""
        return np.dot(X, self.w_[1:]) + self.w_[0]

    def predict(self, X):
        """Return class label after unit step"""
        return np.where(self.net_input(X) >= 0.0, 1, -1)
v1 = np.array([1, 2, 3])
v2 = 0.5 * v1
np.arccos(v1.dot(v2) / (np.linalg.norm(v1) * np.linalg.norm(v2)))
0.0
Training a perceptron model on the Iris dataset
使用鸢尾花数据集训练一个感知机模型
…
Reading-in the Iris data
读取Iris数据集
import os
import pandas as pd


s = 'https://archive.ics.uci.edu/ml/machine-learning-databases/iris/iris.data'
print('URL:', s)

df = pd.read_csv(s,
                 header=None,
                 encoding='utf-8')

df.tail()
URL: https://archive.ics.uci.edu/ml/machine-learning-databases/iris/iris.data
| 0 | 1 | 2 | 3 | 4 | |
|---|---|---|---|---|---|
| 145 | 6.7 | 3.0 | 5.2 | 2.3 | Iris-virginica |
| 146 | 6.3 | 2.5 | 5.0 | 1.9 | Iris-virginica |
| 147 | 6.5 | 3.0 | 5.2 | 2.0 | Iris-virginica |
| 148 | 6.2 | 3.4 | 5.4 | 2.3 | Iris-virginica |
| 149 | 5.9 | 3.0 | 5.1 | 1.8 | Iris-virginica |
Note:
You can find a copy of the Iris dataset (and all other datasets used in this book) in the code bundle of this book, which you can use if you are working offline or the UCI server at https://archive.ics.uci.edu/ml/machine-learning-databases/iris/iris.data is temporarily unavailable. For instance, to load the Iris dataset from a local directory, you can replace the line
df = pd.read_csv('https://archive.ics.uci.edu/ml/'
    'machine-learning-databases/iris/iris.data', header=None)
by
df = pd.read_csv('your/local/path/to/iris.data', header=None)
df = pd.read_csv('iris.data', header=None, encoding='utf-8')
df.tail()
| 0 | 1 | 2 | 3 | 4 | |
|---|---|---|---|---|---|
| 145 | 6.7 | 3.0 | 5.2 | 2.3 | Iris-virginica |
| 146 | 6.3 | 2.5 | 5.0 | 1.9 | Iris-virginica |
| 147 | 6.5 | 3.0 | 5.2 | 2.0 | Iris-virginica |
| 148 | 6.2 | 3.4 | 5.4 | 2.3 | Iris-virginica |
| 149 | 5.9 | 3.0 | 5.1 | 1.8 | Iris-virginica |
Plotting the Iris data
绘制Iris 数据的图示示例
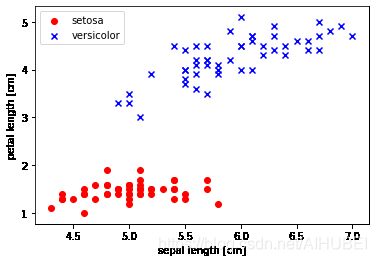
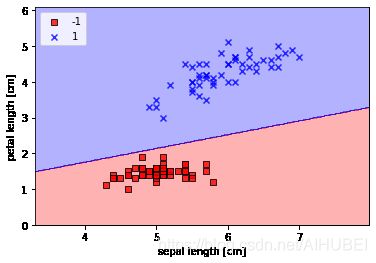
提取前100类别标签的数据,其中Iris-setosa和Iris-versicolor各50.类似的从这100条样本中提取第一(sepal length)和第三(petal length)列所对应的特征列,然后将其分派到特征矩阵中,这样一来我们就可以通过二维的散点图来进行可视化。
%matplotlib inline
import matplotlib.pyplot as plt
import numpy as np

# select setosa and versicolor
y = df.iloc[0:100, 4].values
y = np.where(y == 'Iris-setosa', -1, 1)

# extract sepal length and petal length
X = df.iloc[0:100, [0, 2]].values

# plot data
plt.scatter(X[:50, 0], X[:50, 1],
            color='red', marker='o', label='setosa')
plt.scatter(X[50:100, 0], X[50:100, 1],
            color='blue', marker='x', label='versicolor')

plt.xlabel('sepal length [cm]')
plt.ylabel('petal length [cm]')
plt.legend(loc='upper left')

# plt.savefig('images/02_06.png', dpi=300)
plt.show()
Training the perceptron model
训练感知机模型
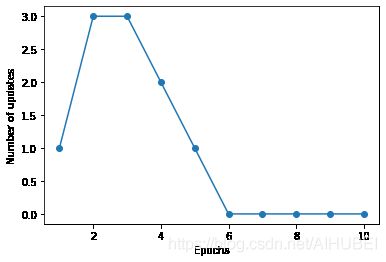
ppn = Perceptron(eta=0.1, n_iter=10)

ppn.fit(X, y)

plt.plot(range(1, len(ppn.errors_) + 1), ppn.errors_, marker='o')
plt.xlabel('Epochs')
plt.ylabel('Number of updates')

# plt.savefig('images/02_07.png', dpi=300)
plt.show()
A function for plotting decision regions
一个绘制决策决策区域的函数
首先通过ListedColormap来创建一系列的颜色和标记同时创建一个调色板colormap,然后我们确定特征的最小值和最大值,通过numpy meshgris 函数,并使用这些特征向量创建一对网格阵列xx1,xx2,由于我们在两个特征维度上训练了感知器分类器,因此我们需要展平栅格阵列并创建一个矩阵,该矩阵的列数与Iris训练子集相同,因此我们可以使用predict 方法来预测类别标签z,
from matplotlib.colors import ListedColormap


def plot_decision_regions(X, y, classifier, resolution=0.02):

    # setup marker generator and color map
    markers = ('s', 'x', 'o', '^', 'v')
    colors = ('red', 'blue', 'lightgreen', 'gray', 'cyan')
    cmap = ListedColormap(colors[:len(np.unique(y))])

    # plot the decision surface
    # 分别使用样本的两个特征值创建图像和横轴和纵轴
    x1_min, x1_max = X[:, 0].min() - 1, X[:, 0].max() + 1
    x2_min, x2_max = X[:, 1].min() - 1, X[:, 1].max() + 1
    xx1, xx2 = np.meshgrid(np.arange(x1_min, x1_max, resolution),
                           np.arange(x2_min, x2_max, resolution))
    Z = classifier.predict(np.array([xx1.ravel(), xx2.ravel()]).T)
    # 给每个分类中的样本分配不同的颜色
    Z = Z.reshape(xx1.shape)
    plt.contourf(xx1, xx2, Z, alpha=0.3, cmap=cmap)
    plt.xlim(xx1.min(), xx1.max())
    plt.ylim(xx2.min(), xx2.max())

    # plot class examples
    for idx, cl in enumerate(np.unique(y)):
        plt.scatter(x=X[y == cl, 0],
                    y=X[y == cl, 1],
                    alpha=0.8,
                    c=colors[idx],
                    marker=markers[idx],
                    label=cl,
                    edgecolor='black')
plot_decision_regions(X, y, classifier=ppn)
plt.xlabel('sepal length [cm]')
plt.ylabel('petal length [cm]')
plt.legend(loc='upper left')


# plt.savefig('images/02_08.png', dpi=300)
plt.show()
Adaptive linear neurons and the convergence of learning
自适应线性神经元和学习的收敛性
…
Minimizing cost functions with gradient descent
通过梯度下降来最小化损失函数
Image(filename='./images/02_09.png', width=600)
Image(filename='./images/02_10.png', width=500)
Implementing an adaptive linear neuron in Python
使用python实现一个自适应线性神经元
class AdalineGD(object):
    """ADAptive LInear NEuron classifier.

    Parameters
    ------------
    eta : float
      Learning rate (between 0.0 and 1.0)
    n_iter : int
      Passes over the training dataset.
    random_state : int
      Random number generator seed for random weight
      initialization.


    Attributes
    -----------
    w_ : 1d-array
      Weights after fitting.
    cost_ : list
      Sum-of-squares cost function value in each epoch.

    """
    def __init__(self, eta=0.01, n_iter=50, random_state=1):
        self.eta = eta
        self.n_iter = n_iter
        self.random_state = random_state

    def fit(self, X, y):
        """ Fit training data.

        Parameters
        ----------
        X : {array-like}, shape = [n_examples, n_features]
          Training vectors, where n_examples is the number of examples and
          n_features is the number of features.
        y : array-like, shape = [n_examples]
          Target values.

        Returns
        -------
        self : object

        """
        rgen = np.random.RandomState(self.random_state)
        self.w_ = rgen.normal(loc=0.0, scale=0.01, size=1 + X.shape[1])
        self.cost_ = []

        for i in range(self.n_iter):
            net_input = self.net_input(X)
            # Please note that the "activation" method has no effect
            # in the code since it is simply an identity function. We
            # could write `output = self.net_input(X)` directly instead.
            # The purpose of the activation is more conceptual, i.e.,
            # in the case of logistic regression (as we will see later),
            # we could change it to
            # a sigmoid function to implement a logistic regression classifier.
            output = self.activation(net_input)
            errors = (y - output)
            self.w_[1:] += self.eta * X.T.dot(errors)
            self.w_[0] += self.eta * errors.sum()
            cost = (errors**2).sum() / 2.0
            self.cost_.append(cost)
        return self

    def net_input(self, X):
        """Calculate net input"""
        return np.dot(X, self.w_[1:]) + self.w_[0]

    def activation(self, X):
        """Compute linear activation"""
        return X

    def predict(self, X):
        """Return class label after unit step"""
        return np.where(self.activation(self.net_input(X)) >= 0.0, 1, -1)
fig, ax = plt.subplots(nrows=1, ncols=2, figsize=(10, 4))

ada1 = AdalineGD(n_iter=10, eta=0.01).fit(X, y)
ax[0].plot(range(1, len(ada1.cost_) + 1), np.log10(ada1.cost_), marker='o')
ax[0].set_xlabel('Epochs')
ax[0].set_ylabel('log(Sum-squared-error)')
ax[0].set_title('Adaline - Learning rate 0.01')

ada2 = AdalineGD(n_iter=10, eta=0.0001).fit(X, y)
ax[1].plot(range(1, len(ada2.cost_) + 1), ada2.cost_, marker='o')
ax[1].set_xlabel('Epochs')
ax[1].set_ylabel('Sum-squared-error')
ax[1].set_title('Adaline - Learning rate 0.0001')

# plt.savefig('images/02_11.png', dpi=300)
plt.show()
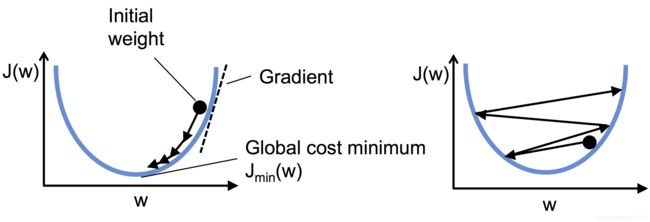
上面:左图显示出学习率挑选过大,犹如显示出学习率挑选太小,如下所示:左边的图显示出合适的学习率,损失逐渐减小,一直到全局最小;
右边的图显示出:学习率过大,越过了全局最小值;
Image(filename='./images/02_12.png', width=700)
Improving gradient descent through feature scaling
通过特征缩放改进梯度下降
Image(filename='./images/02_13.png', width=700)
# standardize features
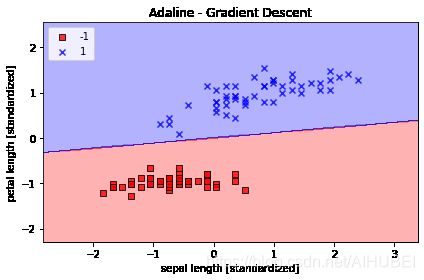
# 标准化处理过程有助于实现梯度学习直到收敛更加快速,但是:他会使得原始数据集
# 不呈正太分布
X_std = np.copy(X)
X_std[:, 0] = (X[:, 0] - X[:, 0].mean()) / X[:, 0].std()
X_std[:, 1] = (X[:, 1] - X[:, 1].mean()) / X[:, 1].std()
ada_gd = AdalineGD(n_iter=15, eta=0.01)
ada_gd.fit(X_std, y)

plot_decision_regions(X_std, y, classifier=ada_gd)
plt.title('Adaline - Gradient Descent')
plt.xlabel('sepal length [standardized]')
plt.ylabel('petal length [standardized]')
plt.legend(loc='upper left')
plt.tight_layout()
# plt.savefig('images/02_14_1.png', dpi=300)
plt.show()

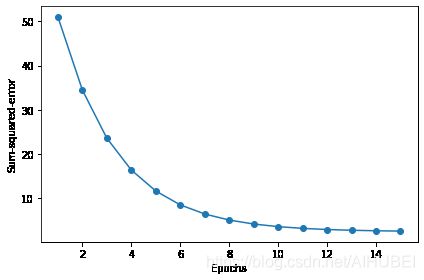
plt.plot(range(1, len(ada_gd.cost_) + 1), ada_gd.cost_, marker='o')
plt.xlabel('Epochs')
plt.ylabel('Sum-squared-error')

plt.tight_layout()
# plt.savefig('images/02_14_2.png', dpi=300)
plt.show()
Large scale machine learning and stochastic gradient descent
大规模机器学习和随机梯度下降
class AdalineSGD(object):
    """ADAptive LInear NEuron classifier.

    Parameters
    ------------
    eta : float
      Learning rate (between 0.0 and 1.0)
    n_iter : int
      Passes over the training dataset.
    shuffle : bool (default: True)
      Shuffles training data every epoch if True to prevent cycles.
    random_state : int
      Random number generator seed for random weight
      initialization.


    Attributes
    -----------
    w_ : 1d-array
      Weights after fitting.
    cost_ : list
      Sum-of-squares cost function value averaged over all
      training examples in each epoch.


    """
    def __init__(self, eta=0.01, n_iter=10, shuffle=True, random_state=None):
        self.eta = eta
        self.n_iter = n_iter
        self.w_initialized = False
        self.shuffle = shuffle
        self.random_state = random_state

    def fit(self, X, y):
        """ Fit training data.

        Parameters
        ----------
        X : {array-like}, shape = [n_examples, n_features]
          Training vectors, where n_examples is the number of examples and
          n_features is the number of features.
        y : array-like, shape = [n_examples]
          Target values.

        Returns
        -------
        self : object

        """
        self._initialize_weights(X.shape[1])
        self.cost_ = []
        for i in range(self.n_iter):
            if self.shuffle:
                X, y = self._shuffle(X, y)
            cost = []
            for xi, target in zip(X, y):
                cost.append(self._update_weights(xi, target))
            avg_cost = sum(cost) / len(y)
            self.cost_.append(avg_cost)
        return self

    def partial_fit(self, X, y):
        """Fit training data without reinitializing the weights"""
        if not self.w_initialized:
            self._initialize_weights(X.shape[1])
        if y.ravel().shape[0] > 1:
            for xi, target in zip(X, y):
                self._update_weights(xi, target)
        else:
            self._update_weights(X, y)
        return self

    def _shuffle(self, X, y):
        """Shuffle training data"""
        r = self.rgen.permutation(len(y))
        return X[r], y[r]

    def _initialize_weights(self, m):
        """Initialize weights to small random numbers"""
        self.rgen = np.random.RandomState(self.random_state)
        self.w_ = self.rgen.normal(loc=0.0, scale=0.01, size=1 + m)
        self.w_initialized = True

    def _update_weights(self, xi, target):
        """Apply Adaline learning rule to update the weights"""
        output = self.activation(self.net_input(xi))
        error = (target - output)
        self.w_[1:] += self.eta * xi.dot(error)
        self.w_[0] += self.eta * error
        cost = 0.5 * error**2
        return cost

    def net_input(self, X):
        """Calculate net input"""
        return np.dot(X, self.w_[1:]) + self.w_[0]

    def activation(self, X):
        """Compute linear activation"""
        return X

    def predict(self, X):
        """Return class label after unit step"""
        return np.where(self.activation(self.net_input(X)) >= 0.0, 1, -1)
ada_sgd = AdalineSGD(n_iter=15, eta=0.01, random_state=1)
ada_sgd.fit(X_std, y)

plot_decision_regions(X_std, y, classifier=ada_sgd)
plt.title('Adaline - Stochastic Gradient Descent')
plt.xlabel('sepal length [standardized]')
plt.ylabel('petal length [standardized]')
plt.legend(loc='upper left')

plt.tight_layout()
# plt.savefig('images/02_15_1.png', dpi=300)
plt.show()

plt.plot(range(1, len(ada_sgd.cost_) + 1), ada_sgd.cost_, marker='o')
plt.xlabel('Epochs')
plt.ylabel('Average Cost')

plt.tight_layout()
# plt.savefig('images/02_15_2.png', dpi=300)
plt.show()
ada_sgd.partial_fit(X_std[0, :], y[0])
<__main__.AdalineSGD at 0x1e018370508>
Summary
…
Readers may ignore the following cell
! python ../.convert_notebook_to_script.py --input ch02.ipynb --output ch02.py
[NbConvertApp] Converting notebook ch02.ipynb to script
[NbConvertApp] Writing 16677 bytes to ch02.py
