Scipy.cluster.vq.kmeans
博文首文,最近做毕设挺不顺利的,就来写篇博文吧。
本来想用pyhton来时间K-means聚类分析的,查了一下,可用的包有著名的机器学习的包:sklearn,但是我做的成果必须要集成到Arcmap这个软甲里面,这个包不知道为何在Arcgis自带的python环境下总是安装不成功,但是用annaconda测试成功过了,代码以后再贴。
下面说一下Arcgis10.5的python自带的科学计算包Scipy如何时间K-means聚类好了。
代码的实现主要也是参考的官方帮助。
#!/usr/bin/python
# -*- coding: utf-8 -*-
#Scipy聚类效果测试
import numpy as np
from scipy.cluster.vq import vq, kmeans, whiten
import matplotlib.pyplot as plt
pts = 50
a = np.random.multivariate_normal([0, 0], [[4, 1], [1, 4]], size=pts)
b = np.random.multivariate_normal([30, 10],
                             [[10, 2], [2, 1]],
                                   size=pts)#np.random.multivariate_normal这个官方解释说从多元正态分布中抽取随机样本
features = np.concatenate((a, b))
#print(features)
print(features.shape)
whitened = whiten(features)
print(whitened)
codebook, distortion = kmeans(whitened, 2)  #这个Kmeans好像只返回聚类中心、观测值和聚类中心之间的失真
plt.scatter(whitened[:, 0], whitened[:, 1],c = 'g')
plt.scatter(codebook[:, 0], codebook[:, 1], c='r')
plt.show()
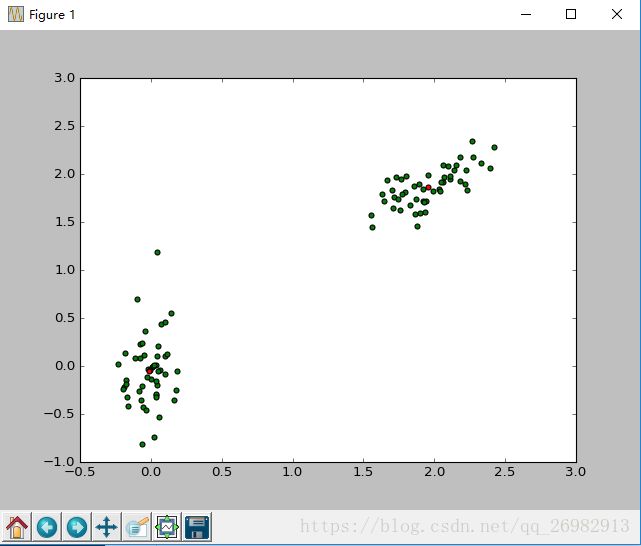
运行以后的结果如图所示,红色的点点为聚类中心:
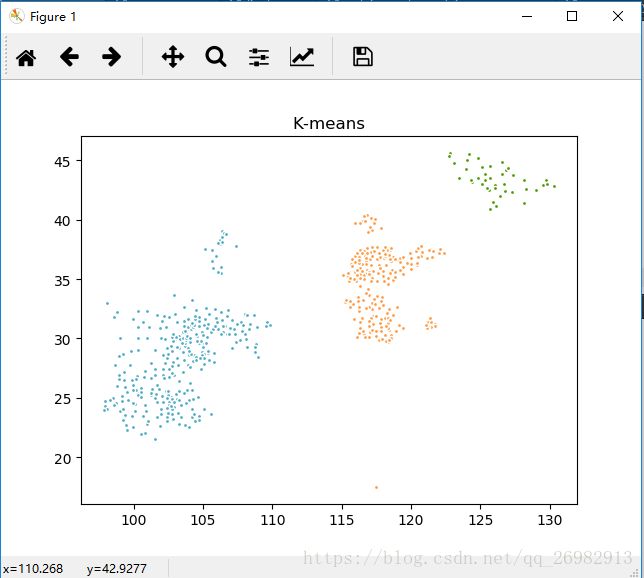
下面使用sklearn实现的K-means聚类,效果也很好
#!/usr/bin/python
# -*- coding: utf-8 -*-
import numpy as np
import matplotlib.pyplot as plt
from sklearn.cluster import KMeans
from sklearn.metrics.pairwise import pairwise_distances_argmin
#从磁盘中读取经纬数据
X = []
f = open('E:/PyCharm Community Edition 5.0.3/city.txt')
for v in f:
    X.append([float(v.split(',')[1]),float(v.split(',')[2])])
X = np.array(X)
print(X)
n_cluster = 3
cls = KMeans(n_cluster).fit(X)
cls.labels_
print(cls)
colors = ['#4EACC5','#FF9C43','#4E9A06']
k_means_cluster_centers = np.sort(cls.cluster_centers_, axis=0)
k_means_labels = pairwise_distances_argmin(X, k_means_cluster_centers)
for k, col in zip(range(n_cluster), colors):
    my_members = k_means_labels == k
    cluster_center = k_means_cluster_centers[k]
    plt.plot(X[my_members, 0], X[my_members, 1], 'w',
            markerfacecolor=col, marker='.')
    #plt.plot(cluster_center[0], cluster_center[1], 'o', markerfacecolor=col,
            #markeredgecolor='k', markersize=6)
plt.title('K-means')
plt.show()

