highchart横纵坐标都是时间轴 的实现
 //自定义Date的格式
Date.prototype.Format = function (fmt) { //author: meizz
var o = {
"M+": this.getMonth() + 1, //月份
"d+": this.getDate(), //日
"h+": this.getHours(), //小时
"m+": this.getMinutes(), //分
"s+": this.getSeconds(), //秒
"q+": Math.floor((this.getMonth() + 3) / 3), //季度
"S": this.getMilliseconds() //毫秒
};
if (/(y+)/.test(fmt)) fmt = fmt.replace(RegExp.$1, (this.getFullYear() + "").substr(4 - RegExp.$1.length));
for (var k in o)
if (new RegExp("(" + k + ")").test(fmt)) fmt = fmt.replace(RegExp.$1, (RegExp.$1.length == 1) ? (o[k]) : (("00" + o[k]).substr(("" + o[k]).length)));
return fmt;
}
//自定义Date的格式
Date.prototype.Format = function (fmt) { //author: meizz
var o = {
"M+": this.getMonth() + 1, //月份
"d+": this.getDate(), //日
"h+": this.getHours(), //小时
"m+": this.getMinutes(), //分
"s+": this.getSeconds(), //秒
"q+": Math.floor((this.getMonth() + 3) / 3), //季度
"S": this.getMilliseconds() //毫秒
};
if (/(y+)/.test(fmt)) fmt = fmt.replace(RegExp.$1, (this.getFullYear() + "").substr(4 - RegExp.$1.length));
for (var k in o)
if (new RegExp("(" + k + ")").test(fmt)) fmt = fmt.replace(RegExp.$1, (RegExp.$1.length == 1) ? (o[k]) : (("00" + o[k]).substr(("" + o[k]).length)));
return fmt;
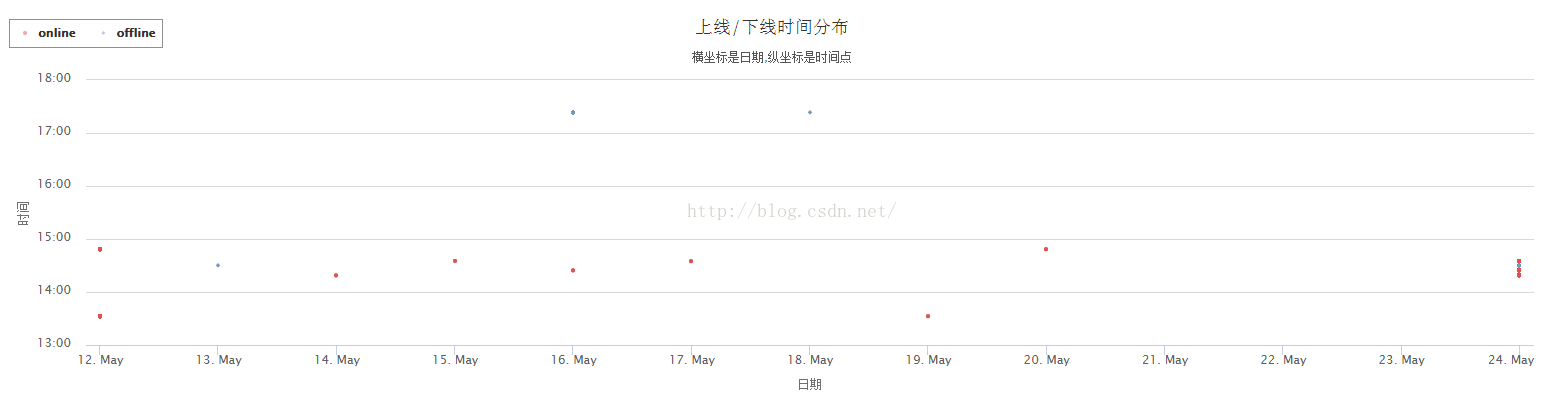
}//online,offline时间分布.日期为横坐标,小时分钟为纵坐标
$('#hash').click(function(e) {
e.preventDefault();
$('#tableContainer').hide();
$('#picContainer').hide();
$('#hashContainer').show();
var str = new Array(num);
//timestamp格式 2013-09-30 18:34:27
for (var ii = 0; ii < num; ii++) {
var temp = datasort[ii]['timestamp'].split(' ');
var yy = parseInt(temp[1].substr(0, 2)) * 3600 + parseInt(temp[1].substr(3, 2)) * 60 + parseInt(temp[1].substr(6, 2));
yy = yy * 1000;
var arr=temp[0].split('-');
var d=Date.UTC(arr[0],arr[1]-1,arr[2]);//把日期转化成毫秒数
str.push(d);
if (datasort[ii]['status'] == 'online') {
dataon.push([d,yy]);
}
else {
dataoff.push([d,yy]);
}
}
$('#hashContainer').highcharts({
chart: {
type: 'scatter',
zoomType: 'xy'
},
title: {
text: '上线/下线时间分布'
},
subtitle: {
text: '横坐标是日期,纵坐标是时间点'
},
xAxis: {
type: 'datetime',
title: {
text: '日期'
},
dateTimeLabelFormats: {
millisecond: '%Y:%m:%d'
}
},
yAxis: {
title: {
text: '时间'
},
type: 'datetime',
dateTimeLabelFormats: {
millisecond: '%H:%M:%S.%L'
}
},
legend: {
layout: 'horizontal',
align: 'left',
verticalAlign: 'top',
floating: true,
backgroundColor: '#FFFFFF',
borderWidth: 1
},
credits:{
enabled:false // 禁用版权信息
},
scrollBar: {
enabled: true
},
plotOptions: {
scatter: {
marker: {
radius: 2,
states: {
hover: {
enabled: true,
lineColor: 'rgb(100,100,100)'
}
}
},
states: {
hover: {
marker: {
enabled: false
}
}
},
tooltip: {
shared: true,
headerFormat: '{series.name}
',
pointFormat: '{point.x:%Y-%m-%d},{point.y:%H:%M:%S} '//这个就是设置hover在那个点的格式设置关键所在
}
}
},
series: [{
name: 'online',
color: 'rgba(223, 83, 83, .5)',
data: dataon
}, {
name: 'offline',
color: 'rgba(119, 152, 191, .5)',
data: dataoff
}]
});
});我觉得用highcharts显示时间最简单的方法就是把时间用Date.UTC方法转化成毫秒数,再用
dateTimeLabelFormats把他设置回来你想要的形式效果图