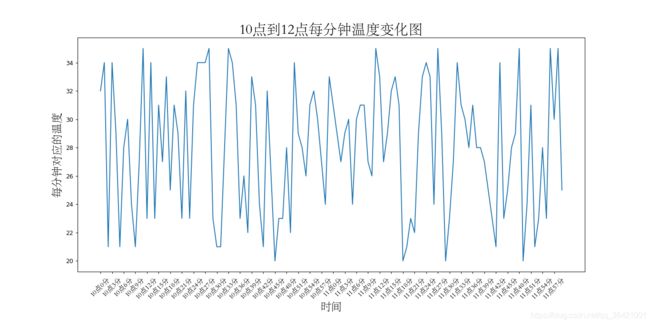
1.matplotlib的坐标轴中一般是不支持中文,在windows中要使用中文坐标轴的话,需要调用电脑中的字体。 实现代码:
from matplotlib import font_manager
my_font = font_manager.FontProperties(fname="C:/WINDOWS/Fonts/STSONG.TTF")
plt.xlabel("时间",fontproperties = my_font,fontsize = 18)
完整代码实例如下:
from matplotlib import pyplot as plt
from matplotlib import font_manager
import random
my_font = font_manager.FontProperties(fname="C:/WINDOWS/Fonts/STSONG.TTF")
y = [random.randint(20,35) for i in range(120)]
x = range(0,120)
plt.figure(figsize=(15,10),dpi=90)
_x_labels = ["10点{}分".format(i) for i in range(60)]
_x_labels += ["11点{}分".format(i) for i in range(60)]
plt.xticks(list(x[::3]),_x_labels[::3],rotation=45,fontproperties=my_font,fontsize = 12)
plt.plot(x,y)
plt.xlabel("时间",fontproperties = my_font,fontsize = 18)
plt.ylabel("每分钟对应的温度",fontproperties = my_font,fontsize = 18)
plt.title("10点到12点每分钟温度变化图",fontproperties = my_font,fontsize = 24)
plt.plot(x,y)
plt.show()
图片结果如图所示:
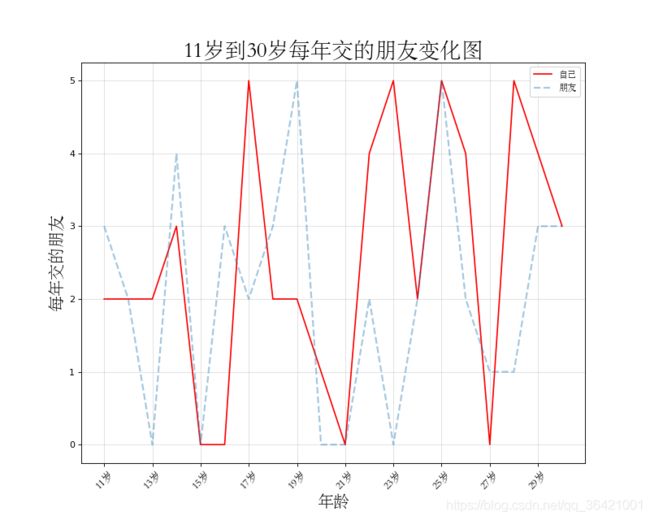
2.绘制两条折线及添加图例,添加网格
from matplotlib import pyplot as plt
from matplotlib import font_manager
import random
plt.figure(figsize=(10,8),dpi=80)
my_font = font_manager.FontProperties(fname="C:/WINDOWS/Fonts/STSONG.TTF")
x = range(11,31)
y_1 = [random.randint(0,5) for i in range(20)]
y_2 = [random.randint(0,5) for i in range(20)]
_x_label = ["{}岁".format(i) for i in range(11,31)]
plt.xticks(list(x[::2]),_x_label[::2],rotation = 45,fontproperties = my_font,fontsize = 12)
plt.plot(x,y_1,label = "自己",color="red")
plt.plot(x,y_2,label= "朋友",linestyle="--",linewidth=2,alpha = 0.4)
plt.xlabel("年龄",fontproperties = my_font,fontsize = 18)
plt.ylabel("每年交的朋友",fontproperties = my_font,fontsize = 18)
plt.title("11岁到30岁每年交的朋友变化图",fontproperties = my_font,fontsize = 24)
plt.grid(alpha = 0.4)
plt.legend(prop=my_font,loc='best')
plt.show()
图片结果如图所示: