第04章-VTK基础(5)
【译者:这个系列教程是以Kitware公司出版的《VTK User’s Guide -11th edition》一书作的中文翻译(出版时间2010年,ISBN: 978-1-930934-23-8),由于时间关系,我们不能保证每周都能更新本书内容,但尽量做到一周更新一篇到两篇内容。敬请期待^_^。欢迎转载,另请转载时注明本文出处,谢谢合作!同时,由于译者水平有限,出错之处在所难免,欢迎指出订正!】
【本小节内容对应原书的第63页至第70页】
4.11 文本标注
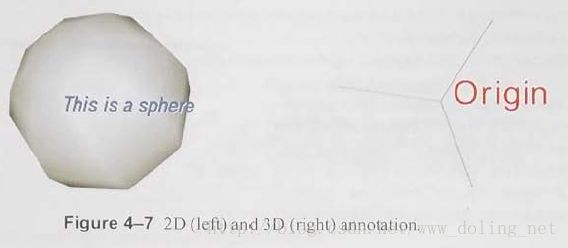
VTK提供了两种方法用于标注图像。第一种是可以在三维图形窗口的顶层上绘制的文本(和图形),通常涉及的是在层叠平面上绘制。第二种是创建三维的多边形数据的文本,可以像其他三维图形对象一样进行变换及显示。这两种类型的标注分别称为二维和三维标注,从图4-7中可以看出它们的区别。
图4-7 二维(左)和三维(右)标注
二维文本标注
使用二维文本标注时,需要用到二维的Actor(vtkActor2D或它的子类,如vtkScaledTextActor)和Mapper(vtkMapper2D或其子类vtkTextMapper)。二维的Actor和Mapper跟三维的类似,不同的是前者是在图形或图像的顶层层叠平面(overlay plane)上进行渲染的。下面的例子摘自VTK/Examples/Annotation/Tcl/TestText.tcl,结果如图4-7所示。
vtkSphereSource sphere

vtkPolyDataMapper sphereMapper
    sphereMapper SetInputConnection [sphere GetOutputPort]
    sphereMapper GlobalImmediateModeRenderingOn
vtkLODActor sphereActor
    sphereActor SetMapper sphereMapper

#Create a scaled text actor.
#Set the text, font, justification, and properties (bold, italics, etc.).
vtkTextActor textActor
    textActor SetTextScaleModeToProp
    textActor SetDisplayPosition 90 50
    textActor SetInput "This is asphere"

    # Set coordinates to match the oldvtkScaledTextActor default value
    [textActor GetPosition2Coordinate] SetCoordinateSystemToNormalizedViewport
    [textActor GetPosition2Coordinate] SetValue0.6 0.1

set tprop [textActor GetTextProperty]
    $tprop SetFontSize 18
    $tprop SetFontFamilyToArial
    $tprop SetJustificationToCentered
    $tprop BoldOn
    $tprop ItalicOn
    $tprop ShadowOn
    $tprop SetColor 0 0 1

#Create the Renderer, RenderWindow, RenderWindowInteractor
#
vtkRenderer ren1
vtkRenderWindow renWin
    renWin AddRenderer ren1
vtkRenderWindowInteractor iren
    iren SetRenderWindow renWin

#Add the actors to the renderer; set the background and size; zoom in;
#and render.
#
ren1 AddViewProp textActor
ren1 AddViewProp sphereActor
vtkTextProperty实例可以设置字体(Arial,Courier或者Times等),文本颜色,粗体、斜体开关以及字体的阴影效果等。字体的阴影效果可以使标注的文本在复杂背景下可读性更强。标注文本的位置和颜色则通过关联的vtkActor2D控制的。在这个例子中,文本的位置是用显示坐标或者像素坐标进行设置的。
vtkTextProperty也支持对齐(垂直和水平)及多行文本。方法SetJustificationToLeft(),SetJustificationToCentered()和SetJustificationToRight()可以控制水平对齐方向。SetVerticalJustificationToBottom(),SetVerticalJustificationToCentered()和SetVerticalJustificationToTop()等方法可以控制垂直对齐方向,缺省的对齐方向是左下角对齐。文本中嵌入“\n”字符可以支持多行文本。图4-8是对齐和多行文本的效果,该例子摘自VTK/Examples/Annotation/Tcl/multiLineText.tcl。以下是例子的主要代码:
vtkTextMapper textMapperL
    textMapperL SetInput "Thisis\nmulti-line\ntext output\n(left-top)"
    set tprop [textMapperL GetTextProperty]
    $tprop ShallowCopy multiLineTextProp
    $tprop SetJustificationToLeft
    $tprop SetVerticalJustificationToTop
    $tprop SetColor 1 0 0
vtkActor2D textActorL
    textActorL SetMapper textMapperL
    [textActorL GetPositionCoordinate]SetCoordinateSystemToNormalizedDisplay
    [textActorL GetPositionCoordinate] SetValue0.05 0.5
图4-8 文本对齐和多行文本。在文本里嵌入“\n”字符可以生成多行文本,支持水平和垂直对齐
注意,以上代码使用vtkCoordinate对象(调用方法GetPositionCoordinate()获得)控制Actor在NormalizedDisplay坐标系统下位置。参考“vtkCoordinate和坐标系统”一节,了解更多关于放置文本标注的信息。
三维文本标注与vtkFollower
三维文本标注的实现是使用vtkVectorText创建文本字符串的多边形表达形式(Polygonal Representation),然后把它放置在渲染场景中。放置三维文本标注的类是vtkFollower。该类是vtkActor的子类,vtkFollower的对象总是面向渲染器的当前相机,因此可以保证这种文本标注都是可读、可见的。以下的代码演示了如何使用这个类,代码摘自VTK/Examples/Annotation/Tcl/textOrigin.tcl,运行结果如图4-7所示。这个例子创建了一个坐标轴和一个vtkVectorText实例,结合vtkFollower对象标注该坐标轴的原点。
vtkAxes axes
    axes SetOrigin 0 0 0
vtkPolyDataMapper axesMapper
    axesMapper SetInputConnection [axes GetOutputPort]
vtkActor axesActor
    axesActor SetMapper axesMapper

#Create the 3D text and the associated mapper and follower (a type of
#actor).  Position the text so it isdisplayed over the origin of the axes.
vtkVectorText atext
    atext SetText "Origin"
vtkPolyDataMapper textMapper
    textMapper SetInputConnection [atext GetOutputPort]
vtkFollower textActor
    textActor SetMapper textMapper
    textActor SetScale 0.2 0.2 0.2
    textActor AddPosition 0 -0.1 0
…etc…after rendering…
textActor SetCamera [ren1 GetActiveCamera]
当相机绕着坐标轴旋转时,vtkFollower对象会调整自己的方向,使其朝向相机。你可以试着在渲染窗口里,用鼠标移动相机,观察这种变化。
4.12 专用的绘图类
VTK提供了一些复合类用于实现绘图操作。包括绘制标量条、执行简单的X-Y平面绘图以及在三维空间中放置坐标轴等。
标量条
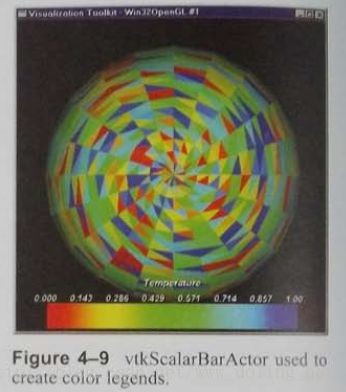
类vtkScalarBarActor用于创建与数值数据相关联的带关键颜色值的颜色条,如图4-9所示。这种标量条由三部分组成,分别是:一个带颜色的矩形条、标注和标题。使用vtkScalarBarActor时,必须含有如下信息:引用一个vtkLookupTable实例(该实例用于定义颜色和数值数据的范围),在层叠平面(overlay plane)上放置颜色条的位置并指定其方向,标注的个数以及标量的文本字符串等。以下例子演示了该类的用法。
图4-9vtkScalarBarActor用于创建颜色条
vtkScalarBarActor scalarBar
  scalarBar SetLookupTable [mapper GetLookupTable]
  scalarBar SetTitle "Temperature"
  [scalarBar GetPositionCoordinate] SetCoordinateSystemToNormalizedViewport
  [scalarBar GetPositionCoordinate] SetValue0.1 0.1
  scalarBar SetOrientationToHorizontal
  scalarBar SetWidth 0.8
  scalarBar SetHeight 0.17
标量条的方向是通过方法SetOrientationToVertical()和SetOrientationToHorizontal()来指定的。位置(即标量条左下角)则是通过不同的坐标系统(允许使用任何坐标系统,见“vtkCoordinate和坐标系统”一节)设置,宽度和高度使用了NormalizedViewport坐标系下的坐标值来指定(或者也可以通过指定标量条右上角的位置,即设置Position2变量的值,间接来设置标量条的宽度和高度)。
X-Y平面绘图
类vtkXYPlotActor可根据输入的一个或多个数据集生成X-Y平面图形,如图4-10所示。该类在显示某个数据变量与一系列点之间的变化情况时非常有用,比如某个变量与探测线或者边界线之间的变化情况。
使用vtkXYPlotActor2D时,必须输入一个或多个数据集,指定坐标轴以及所绘制图形的标题、位置等。该类里的变量PositionCoordinate指定了X-Y图形左下角的位置(定义在Normalizedviewport坐标系下),而变量Position2Coordinate则指定图形的右上角位置坐标。注意:Position2Coordinate是相对于PositionCoordinate而言的,因此可以通过设置PositionCoordinate在视口里移动vtkXYPlotActor。这两个位置确定了图形所在的矩形区域。以下例子演示了该类的用法(程序摘自VTK/Examples/Annotation/Tcl/xyPlot.tcl)
vtkXYPlotActor xyplot
    xyplot AddInput [probe GetOutput]
    xyplot AddInput [probe2 GetOutput]
    xyplot AddInput [probe3 GetOutput]
    [xyplot GetPositionCoordinate] SetValue 0.00.67 0
    [xyplot GetPosition2Coordinate] SetValue1.0 0.33 0;#relative to Position
    xyplot SetXValuesToArcLength
    xyplot SetNumberOfXLabels 6
    xyplot SetTitle "Pressure vs. ArcLength (Zoomed View)"
    xyplot SetXTitle ""
    xyplot SetYTitle "P"
    xyplot SetXRange .1 .35
    xyplot SetYRange .2 .4
    [xyplot GetProperty] SetColor 0 0 0
图4-10使用类vtkXYPlotActor2D来显示分别用三种不同的技术所获取的探测线数据(见VTK/Hybrid/Testing/Tcl/xyPlot.tcl)
注意X轴的定义,缺省情况下,以输入数据集的点的索引作为X轴。也可以使用线的弧长或归一化弧长作为vtkXYPlotActor的输入来生成X值。
带坐标轴的包围盒(vtkCubeAxesActor2D)
另外一个复合的Actor类是vtkCubeAxesAxtor2D。该类可以用于标记相机所观察的空间位置,如图4-11所示。vtkCubeAxesActor2D可以沿着输入数据的包围盒的三个正交边显示X-Y-Z坐标值。当相机放缩时,坐标轴上的坐标值会自适应相机视口的变化而更新。用户可以控制显示的坐标值所用的字体属性以及字体大小等。字体大小可通过方法SetFontFactor()设置。下面的程序演示了这个类的用法(摘自VTK/Examples/Annotation/Tcl/cubeAxes.tcl)。
vtkTextProperty tprop
    tprop SetColor 1 1 1
    tprop ShadowOn
  vtkCubeAxesActor2D axes
    axes SetInput [normals GetOutput]
    axes SetCamera [ren1 GetActiveCamera]
    axes SetLabelFormat "%6.4g"
    axes SetFlyModeToOuterEdges
    axes SetFontFactor 0.8
    axes SetAxisTitleTextProperty tprop
    axes SetAxisLabelTextProperty tprop
图4-11vtkCubeAxesActor2D类的使用。左图中立方体边框的外边缘用于绘制坐标轴,右图将坐标轴放置在距离相机最近的顶点位置上。
注意绘制坐标轴时有两种模式,缺省模式是SetFlyModeToOuterEdges(),即绘制在包围盒的边框外边缘;另一种模式是SetFlyModeToClosestTriad(),把坐标轴放置在距离相机最近的顶点位置上。
标记数据
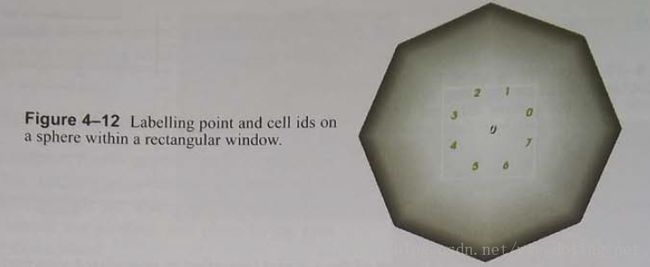
在某些应用程序中可能需要根据底层的数据显示某些数值。vtkLabeledDataMapper就可以用于标记数据集里的点,包括标量、向量、张量、法向量、纹理坐标、域数据(Field Data)以及数据集里点的ID值。文本标记信息放置于所渲染图像的层叠平面上,如图4-12所示。该图是通过运行VTK/Examples/Annotation/Tcl/labeledMesh.tcl例子生成的,本节后面有该例子的部分代码。在这个例子里,用到了三个新类来标记球体的单元和点的ID值,分别是:vtkCellCenters、vtkIdFilter和vtkSelectVisiblePoints。其中vtkCellCenters用于在单元的中心位置生成点,vtkIdFilter则是根据单元和点的ID生成标量值或域数据,也就是说,点的属性数据标量值或域数据是从点的ID值生成的,单元的属性数据标量值或域数据则是根据单元的ID值生成的,vtkSelectVisiblePoints用于选择当前可见的点。另外vtkSelectVisiblePoints还可以在DISPLAY坐标系统下定义一个“窗口”来显示要标记的点的数值,并忽略窗口外的点使其不可见。
图4-12 在一个矩形窗口中标记其所对应的球体下的点和单元的ID值
#Create a sphere and its associated mapper and actor.
vtkSphereSource sphere
vtkPolyDataMapper   sphereMapper
    sphereMapper SetInputConnection [sphereGetOutputPort]
    sphereMapper GlobalImmediateModeRenderingOn
vtkActors phereActor
    sphereActor SetMapper sphereMapper

#Generate data arrays containing point and cell ids
vtkIdFilter ids
    ids SetInputConnection [sphere GetOutputPort]
    ids PointIdsOn
    ids CellIdsOn
    ids FieldDataOn

#Create the renderer here because vtkSelectVisiblePoints needs it.
vtkRenderer ren1

#Create labels for points
vtkSelectVisiblePoints visPts
    visPts SetInputConnection [idsGetOutputPort]
    visPts SetRenderer ren1
    visPts SelectionWindowOn
    visPts SetSelection $xmin [expr $xmin +$xLength] \
          $ymin [expr $ymin + $yLength]

#Create the mapper to display the point ids. Specify the
#format to use for the labels.  Alsocreate the associated actor.
vtkLabeledDataMapper ldm
    ldm SetInputConnection [visPtsGetOutputPort]
#    ldm SetLabelFormat "%g"
    ldm SetLabelModeToLabelFieldData
vtkActor2DpointLabels
    pointLabels SetMapper ldm

#Create labels for cells
vtkCellCenters cc
    cc SetInputConnection [ids GetOutputPort]
vtkSelectVisiblePoints visCells
    visCells SetInputConnection [ccGetOutputPort]
    visCells SetRenderer ren1
    visCells SelectionWindowOn
    visCells SetSelection $xmin [expr $xmin +$xLength] \
          $ymin [expr $ymin + $yLength]
#Create the mapper to display the cell ids. Specify the
#format to use for the labels.  Alsocreate the associated actor.
vtkLabeledDataMapper cellMapper
    cellMapper SetInputConnection [visCells GetOutputPort]
#    cellMapper SetLabelFormat "%g"
    cellMapper SetLabelModeToLabelFieldData
    [cellMapper GetLabelTextProperty] SetColor0 1 0
vtkActor2D cellLabels
    cellLabels SetMapper cellMapper

#Create the RenderWindow and RenderWindowInteractor
#
vtkRenderWindow renWin
    renWin AddRenderer ren1
vtkRenderWindowInteractor iren
    iren SetRenderWindow renWin

#Add the actors to the renderer; set the background and size;
#render
ren1AddActor sphereActor
ren1AddActor2D rectActor
ren1AddActor2D pointLabels
ren1AddActor2D cellLabels

ren1SetBackground 1 1 1
renWinSetSize 500 500
renWinRender


