12-29日作业
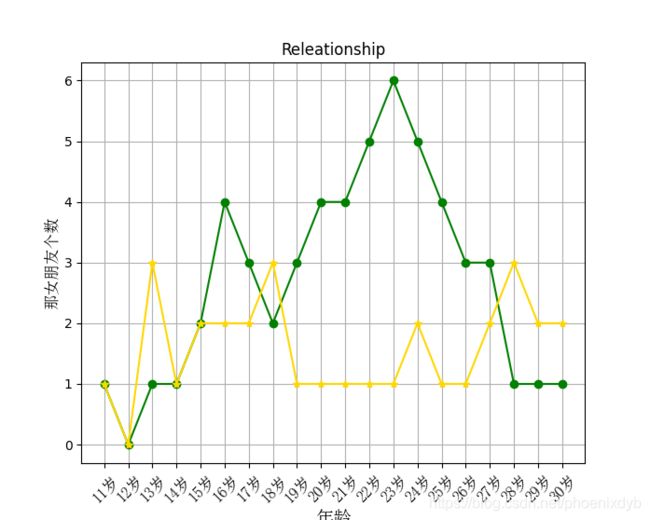
假设大家在30岁的时候,根据自己的实际情况,统计出来了你和同桌从11岁到30岁
每年交的男女朋友的数量如列表a和b,请绘制出该数据的折线图,以便分析自己和同桌每年交男女朋友的数量走势
a = [1,0,1,1,2,4,3,2,3,4,4,5,6,5,4,3,3,1,1,1]
b = [1,0,3,1,2,2,2,3,1,1,1,1,1,2,1,1,2,3,2,2]
要求:
• y轴表示个数
• x轴表示岁数,比如11岁,12岁
'''
假设大家在30岁的时候,根据自己的实际情况,统计出来了你和同桌从11岁到30岁
每年交的男女朋友的数量如列表a和b,请绘制出该数据的折线图,以便分析自己和同桌每年交男女朋友的数量走势
a = [1,0,1,1,2,4,3,2,3,4,4,5,6,5,4,3,3,1,1,1]
b = [1,0,3,1,2,2,2,3,1,1,1,1,1,2,1,1,2,3,2,2]
要求:
• y轴表示个数
• x轴表示岁数,比如11岁,12岁
'''

from matplotlib import pyplot as plt
import matplotlib.font_manager
# 局部方法设置中文字体
font = matplotlib.font_manager.FontProperties(fname=r'c:\windows\fonts\simsun.ttc', size=12)
# y轴数组,len(a)=20
a = [1, 0, 1, 1, 2, 4, 3, 2, 3, 4, 4, 5, 6, 5, 4, 3, 3, 1, 1, 1]

b = [1, 0, 3, 1, 2, 2, 2, 3, 1, 1, 1, 1, 1, 2, 1, 1, 2, 3, 2, 2]
# x轴数组,len(x)=20
x = range(11, 31)
# 创建画布
plt.figure()
# 画布标题
plt.title('Releationship')
# 画布网格
plt.grid()
# x轴刻度标签
_x = ["{}岁".format(i) for i in range(11, 31)]
# x轴刻度
plt.xticks(x, _x, fontproperties=font, rotation=45)
# x轴标签
plt.xlabel("年龄", size=14, fontproperties=font)
# y轴标签
plt.ylabel("那女朋友个数", fontproperties=font)
# 绘图1
plt.plot(x, a, 'g', marker='o')
# 绘图2 公用x轴
plt.plot(x, b, 'gold', marker='*')
# 展现图片
plt.show()

- 好像还缺点什么。。。。。。,对了,黄色和绿色谁代表谁啊???
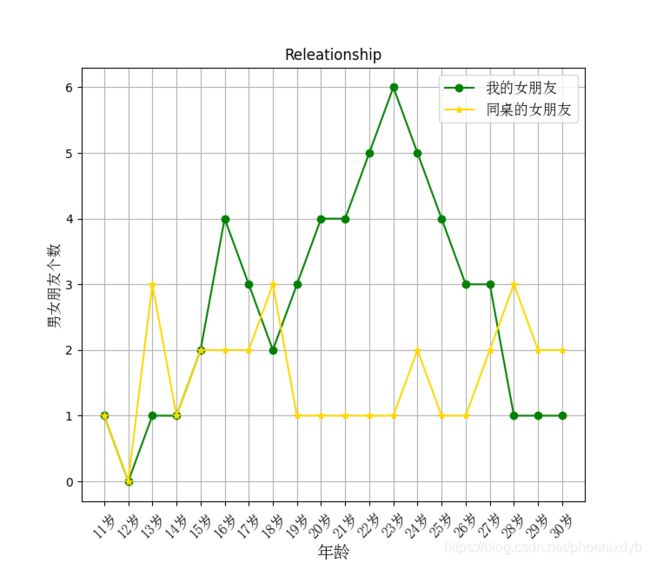
- 应该加上图例说明
from matplotlib import pyplot as plt
import matplotlib.font_manager

# 局部方法设置中文字体
font = matplotlib.font_manager.FontProperties(fname=r'c:\windows\fonts\simsun.ttc', size=12)
# y轴数组,len(a)=20
a = [1, 0, 1, 1, 2, 4, 3, 2, 3, 4, 4, 5, 6, 5, 4, 3, 3, 1, 1, 1]

b = [1, 0, 3, 1, 2, 2, 2, 3, 1, 1, 1, 1, 1, 2, 1, 1, 2, 3, 2, 2]
# x轴数组,len(x)=20
x = range(11, 31)
# 创建画布
plt.figure()
# 画布标题
plt.title('Releationship')
# 画布网格
plt.grid()
# x轴刻度标签
_x = ["{}岁".format(i) for i in range(11, 31)]
# x轴刻度
plt.xticks(x, _x, fontproperties=font, rotation=45)
# x轴标签
plt.xlabel("年龄", size=14, fontproperties=font)
# y轴标签
plt.ylabel("男女朋友个数", fontproperties=font)
# 绘图1
plt.plot(x, a, 'g', marker='o', label='我的女朋友')

# 绘图2 公用x轴
plt.plot(x, b, 'gold', marker='*', label='同桌的女朋友')
plt.legend(prop=font)
# 展现图片
plt.savefig("homework_12_29.png")
plt.show()


