`node2vec` & `TSNE` & 待解决问题
1. node2vec
node2vec: Scalable Feature Learning for Networks
https://github.com/aditya-grover/node2vec
这篇文章不是将它的思路和代码。只是因为在python中居然集成了node2vec,故而感觉很新奇,所以这里来进行一个简单的小实验。
1. 安装
pip install node2vec
2. 训练
使用karate_club_graph数据集,然后进行表示学习。
from node2vec import Node2Vec

a = Karate_graph()
# a.draw_graph()  # 绘制图像
# matrix = a.get_graph_adjacency_matrix()
gn = a.get_karate_club_graph()
n2v = Node2Vec(gn, dimensions=20, walk_length=10, num_walks=20)
model = n2v.fit(window=5, min_count=1)
# 训练的向量表示
node_embeddings = model.wv.vectors
而,Karate_graph类,是我自定义的一个类,方便获取一些数据,如下:
import networkx as nx
import numpy as np
import matplotlib.pyplot as plt
import community as community_louvain
import matplotlib.cm as cm
%matplotlib inline

class Karate_graph(object):
    def __init__(self):
        self.G = nx.karate_club_graph()
        #first compute the best partition
        self.partition = community_louvain.best_partition(self.G)
        # colors
        self.colors = ["BlueViolet", "LawnGreen", "OrangeRed", "Turquoise"] # 33-1紫、32-1绿、1-1红、7-1蓝  , 减1是因为图是从0开始的
    def draw_graph(self):
        """
            绘制其图像
        """
        # draw the graph
        pos = nx.spring_layout(self.G)
        # 节点对应的颜色的封装
        resu = {
     }
        for com in list(set(self.partition.values())):
            nodes = [key for key in self.partition.keys() if self.partition[key] == com]
            if 32 in nodes:
                resu[self.colors[0]] = nodes
            elif 31 in nodes:
                resu[self.colors[1]] = nodes
            elif 0 in nodes:
                resu[self.colors[2]] = nodes
            else:
                resu[self.colors[3]] = nodes
        # 生成节点对应的label字典
        labels = {
     }
        for node in list(self.G.nodes()):
            labels[node] = node+1

        options = {
     "node_size": 250, "alpha": 0.8}
        # nodes
        for color in self.colors:
            nx.draw_networkx_nodes(self.G, pos, nodelist=resu[color], label=resu[color], node_color=color, **options)
        # edges
        nx.draw_networkx_edges(self.G, pos, alpha=0.5)
        # labels
        nx.draw_networkx_labels(self.G, pos, labels, font_size=10, font_color='black')
        plt.axis("off")  # 关闭坐标轴
        plt.show()
        # 保存下颜色字典
        self.node_colors_dict = resu

    def get_graph_adjacency_matrix(self):
        """
            得到其邻接矩阵表示
        """
        return np.array(nx.adjacency_matrix(self.G).todense(), dtype=np.float32)
    def get_karate_club_graph(self):
        """
            得到networkx格式的数据图
        """
        return self.G
    def get_node_colors(self):
        """
            返回节点的颜色列表,方便后面的图像的绘制
        """
        node_colors = [0 for val in range(len(self.G))]
        for key in self.node_colors_dict.keys():
            for node in self.node_colors_dict[key]:
                node_colors[node] = key
        return node_colors
可以简单的使用,a.draw_graph()来绘制图像,即:

然后,在使用node2vec中,可以简单的计算节点相似的节点,即:
def get_similar(name):
    for node, _ in model.most_similar(name):
        print(node)
2. TNSE
一种数据降维的算法实现,相似的还有PCA、LE、MDS、IsoMap等。
它的一种实现在sklearn中集成了,这里就直接使用。
from sklearn.manifold import TSNE
# 定义tsne,映射到2维空间
tsne = TSNE(n_components=2)
node_embeddings = model.wv.vectors
node_embeddings_2d = tsne.fit_transform(node_embeddings)
# 图片标签
node_colors_list = a.get_node_colors()
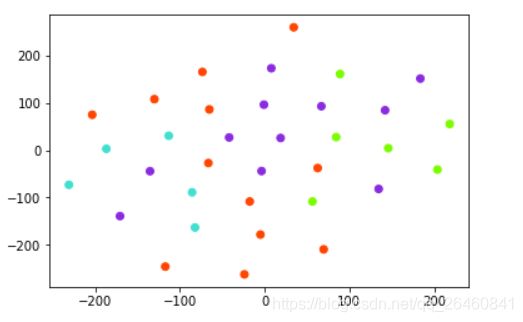
plt.scatter(node_embeddings_2d[:, 0], node_embeddings_2d[:, 1], c=node_colors_list)
但是,得到的东西,不具有论文中常见的聚类效果,如:

对比,Rank2vec中的实验:

这里,就百度了一下,来自这篇博客,here:
那么,猜测是否是数据本身就具有聚类效果,才会导致学习到的嵌入表示具有一定的聚类效果?
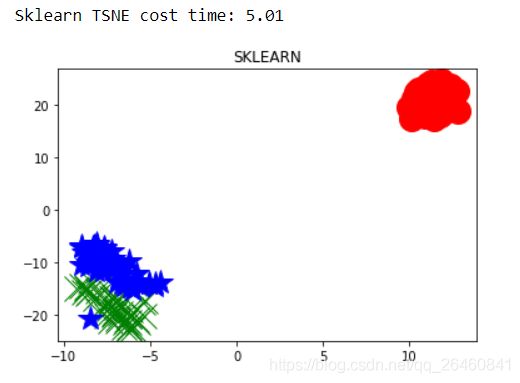
看看,iris数据,即:
from sklearn import datasets,manifold
import time

datas = datasets.load_iris()
t1=time.time()
Y1=manifold.TSNE(2).fit_transform(datas.data)
t2=time.time()
print("Sklearn TSNE cost time: %s"%str(round(t2-t1,2)))
plt.plot(Y1[0:50,0],Y1[0:50,1],'ro',markersize=20)
plt.plot(Y1[50:100,0],Y1[50:100,1],'gx',markersize=20)
plt.plot(Y1[100:150,0],Y1[100:150,1],'b*',markersize=20)
plt.title('SKLEARN')
plt.show()
效果:

很明显,故而,是数据本身具有一定的聚集效果。
那么,在使用node2vec学习节点的表示,再经过t-sne,是如何得到这个图的呢:

还是,中途使用了一些聚类算法来做?
待解决问题!