Python电影数据分析案例
案例说明
这篇案例主要通过网上公开的数据集来练习:Numpy、Pandas 和 matplotlib 库。
•数据源:中国电影数据集•分析目的:
1.查看每年累计票房收入和电影上映数量分布 2.查看每年电影上映数量分布 3.查看每年电影票房收入 4.查看电影类型分布情况
案例
# 导入相关模块
import pandas as pd
import numpy as np
import datetime
from datetime import datetime
from matplotlib import pyplot as plt
plt.rcParams['font.family']=['Arial Unicode MS'] #显示中文日期


# 读取数据
df = pd.read_excel('/movie_data.xlsx')
df.head()
# 查看数据类型
df.info()
RangeIndex: 3134 entries, 0 to 3133
Data columns (total 9 columns):
 #   Column  Non-Null Count  Dtype
---  ------  --------------  -----
 0   电影名     3134 non-null   object
 1   累计票房    2813 non-null   object
 2   导演      2960 non-null   object
 3   主演      2838 non-null   object
 4   上映时间    3133 non-null   object
 5   国家及地区   3129 non-null   object
 6   发行公司    2508 non-null   object
 7   类型      3127 non-null   object
 8   链接      3134 non-null   object
dtypes: object(9)
memory usage: 220.5+ KB
每年累计票房收入和电影上映数量分布
数据清洗
通过查看导入的数据集和数据类型,数据类型均为object对象,需要对部分数据进行清洗,票房收入转为float类型,上映日期转为时间类型
对于累计票房这个字段,我们需计算其累计收入,只需要数字就可以,认真观察其数据规律,累计票房在前四位,万是在最后一位数据, 使用Python字符串截取就可以获取到我想要的数据了,字符串截取的规则为“前闭后开”,str[4:-1]截取第5位和倒数第2位字符。
对于上映日期同样使用字符串截取数据,由于时间格式不统一,部分时间格式后面会带'(', 用str.replace替换就可以了。replace()方法语法:str.replace(old, new[, max]) old : 将被替换的子字符串。new : 新字符串,用于替换old子字符串 max : 可选字符串, 替换不超过 max 次
# 累计票房字符串截取
df['累计票房'] = df['累计票房'].str[4:-1]
# 将票房内容转为float类型
df['累计票房']=df['累计票房'].astype('float')
# 截取日期,取前10位数据
df['上映时间']=df['上映时间'].str[:9]


# 将'('替换为空值
df['上映时间'] = df['上映时间'].str.replace("(","")


# 转化为时间格式
df['上映时间']=pd.to_datetime(df['上映时间'])
# 再次查看数据类型,累计票房为float64格式,上映时间为datetime格式
df.info()
RangeIndex: 3134 entries, 0 to 3133
Data columns (total 9 columns):
 #   Column  Non-Null Count  Dtype
---  ------  --------------  -----
 0   电影名     3134 non-null   object
 1   累计票房    2813 non-null   float64
 2   导演      2960 non-null   object
 3   主演      2838 non-null   object
 4   上映时间    3096 non-null   datetime64[ns]
 5   国家及地区   3129 non-null   object
 6   发行公司    2508 non-null   object
 7   类型      3127 non-null   object
 8   链接      3134 non-null   object
dtypes: datetime64[ns](1), float64(1), object(7)
memory usage: 220.5+ KB
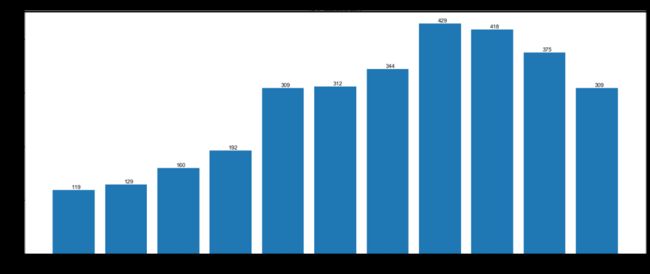
每年电影上映数量分布
# 取日期年份
df['movie_year'] = df['上映时间'].dt.year
# 汇总每年电影数量
movie_years = df.groupby('movie_year')['电影名'].count()
movie_years
movie_year
2008.0    119
2009.0    129
2010.0    160
2011.0    192
2012.0    309
2013.0    312
2014.0    344
2015.0    429
2016.0    418
2017.0    375
2018.0    309
Name: 电影名, dtype: int64
plt.figure(figsize=(20,8),dpi=80)
x = movie_years.index.tolist()
y = movie_years
plt.plot(x,y,color= 'r')
plt.xlabel('上映时间')
plt.ylabel('电影数量')
plt.title('每年电影上映数量分布')
plt.show()
每年电影票房收入
# 汇总每年电影票房收入
movie_gross = df.groupby('movie_year')['累计票房'].sum()
movie_gross
movie_year
2008.0     195164.6
2009.0     299173.5
2010.0     544562.3
2011.0     603550.6
2012.0     835962.5
2013.0    1313336.9
2014.0    1901514.7
2015.0    2924584.6
2016.0    2641407.1
2017.0    3094679.7
2018.0    3162919.8
Name: 累计票房, dtype: float64
plt.figure(figsize=(20,8),dpi=80)
x = movie_years.index.tolist()
y = movie_years
plt.bar(x,y)
for x,y in zip(x, y):
    plt.text(x+0.05,y+0.05,'%i' %y, ha='center',va='bottom') #添加数据标签
plt.xlabel('年份')
plt.ylabel('票房收入')
plt.title('每年电影票房收入')
plt.show()
电影类型数量
对于电影类型,一个电影可能有好几种类型,我们数据源中电影类型是用空格隔开,切割数据就轮到我们的split函数出场啦。split 通过指定分隔符对字符串进行切片,并返回分割后的字符串列表(list) 语法:str.split(str="",num=string.count(str)) str:表示为分隔符,默认为空格,但是不能为空('')。若字符串中没有分隔符,则把整个字符串作为列表的一个元素。
# 对电影类型进行切割
movie_type = df['类型'].str.split(' ')
movie_type
0           [喜剧, 动作]
1       [剧情, 亲情, 灾难]
2           [爱情, 喜剧]
3       [动作, 悬疑, 古装]
4           [动作, 剧情]
            ...
3129        [喜剧, 剧情]
3130            [剧情]
3131        [动作, 悬疑]
3132        [剧情, 古装]
3133        [动作, 剧情]
Name: 类型, Length: 3134, dtype: object
str.split方法的返回值数据类型为Series,Series中的每一个值的数据类型为list,需要通过apply(pd.Series)的方法将list转为Series
# 将列表转为Series
movie_type = movie_type.apply(pd.Series)
movie_type.head()
# 通过 unstack 函数将行旋转为列,重排数据:
movie_type = movie_type.apply(pd.value_counts)
movie_type.unstack()
0  主旋律     NaN
   亲情      NaN
   传奇      NaN
   传记      NaN
   儿童      1.0
          ...
5  革命      NaN
   音乐      NaN
   黑帮      NaN
   黑色      NaN
   黑色幽默    NaN
Length: 408, dtype: float64
# 此时数据为Series,去掉空值,并通过reset_index()转化为Dataframe
movie_type = movie_type.unstack().dropna().reset_index()
movie_type.head()
# 对电影类型汇总
movie_type.columns =['level_0','type','counts']
movie_type_m = movie_type.drop(['level_0'],axis=1).groupby('type').sum().sort_values(by=['counts'],ascending=False).reset_index()
movie_type_m
# 导入绘制树地图包
import squarify
size= [1016,932,759,416,323,300,286,180,148,136,128,105,104,103,92]
name = ["剧情","爱情","喜剧","动作","惊悚","悬疑","动画","冒险","犯罪","战争","恐怖","奇幻","儿童","纪录片","青春"]
colors = ['steelblue','#9999ff','red','indianred', 'green','yellow','orange']
plot = squarify.plot(
       sizes=size, # 指定绘图数据
       color = colors,# 指定自定义颜色
       label=name,# 指定标签
       value=size,# 添加数值标签
       alpha = 0.6,# 指定透明度
       edgecolor = 'white',# 设置边界框为白色
       linewidth =3 # 设置边框宽度为3
  )
plt.rc('font', size=12)
# 设置标题大小
plot.set_title('电影类型分布情况',fontdict = {'fontsize':20})
# 去除坐标轴
plt.axis('off')
# 去除上边框和右边框刻度
plt.tick_params(top = 'off', right = 'off')
# 显示图形
plt.show()
-----------------
长按识别下方二维码,并关注公众号
![]()
1.回复“PY”领取1GB Python数据分析资料
2.回复“BG”领取5GB 名企数据分析报告


