SIFT matlab源代码解析
sift是目前常用的local feature的描述子。sift特征匹配算法可以处理两幅图像之间发生一些平移、旋转、仿射等匹配问题。因为早前自己要做一个图像拼接的问题,所以用到了sift。写这篇blog,是因为自己准备向CV进军,开始着手写blog来积累知识,这也是我第一篇blog,虽然这篇blog很简陋,纯属向sift致敬,但也方便一些初学者使用吧。以后也会不定期对自己的一些在CV的见解进行发表,希望能通过这个和大家相互讨论。如果您想对其原理有个透彻的理解,可以参考下面这篇blog,博主写的非常详尽 —— [ sift算法详解 ]
代码分析
首先,你可以从David Lowe的个人网站http://www.cs.ubc.ca/~lowe/keypoints/” target = “-blank”>[website]找到代码的Version4,download后可以得到有4个m函数,主要看match.m,我对其进行了中文注解:
    % num = match(image1, image2)
    %
    % This function reads two images, finds their SIFT features, and
    %   displays lines connecting the matched keypoints.  A match is accepted
    %   only if its distance is less than distRatio times the distance to the
    %   second closest match.
    % It returns the number of matches displayed.
    %
    % Example: match('scene.pgm','book.pgm');
    % 上面是英文注解,大概意思就是这个函数是找出两幅图能匹配的特征点的个数
    % 你可以在该目录下输入:match('scene.pgm','book.pgm');
    % 便可以得到该文件夹下的两个图像匹配点有多少对。
    function num = match(image1, image2)

    % Find SIFT keypoints for each image
    % 下面两条语句就是找两个图像的sift特征点,其中对于image1而言
    % im1为灰度图像,des1为128维向量,loc1是位置信息
    [im1, des1, loc1] = sift(image1);
    [im2, des2, loc2] = sift(image2);

    % 这个值非常重要,在这里你可以简单理解为它是匹配的一个阈值
    % 或者这样说,distRatio值越大,能匹配的点越多,当然错匹配点也越多
    % 你可以试一下把distRatio改为1时看会怎样
    distRatio = 0.6;

    % For each descriptor in the first image, select its match to second image.
    % 每一层循环就是把image1的每个特征点的128维向量与image2所有向量做一个内积,
    % 对所求得到的数求反cos值并且升序排序后,当前两个值之间的大小差距在由distRatio确定的范围内
    % 则image1的这个特征点在image2中有对应的匹配点,match(i)赋值为1
    % 因为sort会保留下标自然也就找到这个匹配点的坐标
    des2t = des2';                          % Precompute matrix transpose
    for i = 1 : size(des1,1)
       dotprods = des1(i,:) * des2t;        % Computes vector of dot products
       [vals,indx] = sort(acos(dotprods));  % Take inverse cosine and sort results

       % Check if nearest neighbor has angle less than distRatio times 2nd.
       if (vals(1) < distRatio * vals(2))
          match(i) = indx(1);
       else
          match(i) = 0;
       end
    end


    % Create a new image showing the two images side by side.
    % appendimages就是把两张图像在一个figure中一块显示出来,没什么好解释
    im3 = appendimages(im1,im2);

    % Show a figure with lines joining the accepted matches.
    figure('Position', [100 100 size(im3,2) size(im3,1)]);
    colormap('gray');
    imagesc(im3);
    hold on;
    cols1 = size(im1,2);

    % 以下语句就是在匹配的两点之间画条线
    for i = 1: size(des1,1)
      if (match(i) > 0)
        line([loc1(i,2) loc2(match(i),2)+cols1], ...
             [loc1(i,1) loc2(match(i),1)], 'Color', 'c');
      end
    end
    hold off;
    num = sum(match > 0);
    fprintf('Found %d matches.\n', num);
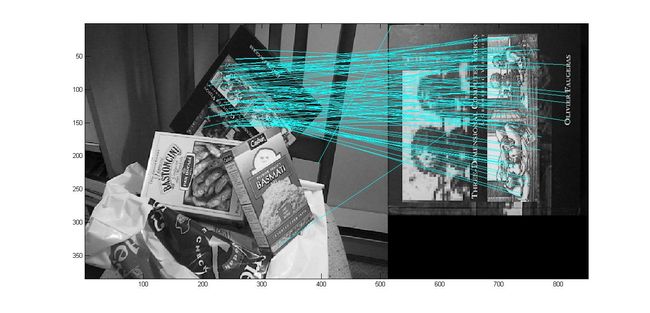
你可以在command window中输入: match(‘scene.pgm’,’book.pgm’);
便可以得到下图:

sift.m因为主要的求解方式被C混编了,所以看不到,所以只给出该函数返回的参数:
% image:灰度图像
% descriptors:对特征点进行描述的128维向量
% locs:是一个4维向量组,前两维为特征点的坐标,第三维是尺度,第四维为方向,详细可以看showkeys.m
% showkeys(image, locs)
%
% This function displays an image with SIFT keypoints overlayed.
%   Input parameters:
%     image: the file name for the image (grayscale)
%     locs: matrix in which each row gives a keypoint location (row,
%           column, scale, orientation)

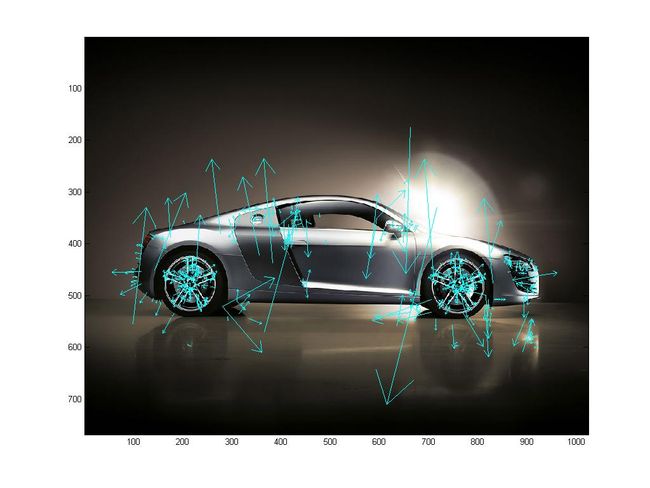
% 该函数是对提取出来的sift特征点在图像上进行一个显示
% 你可以在command window中先输入[image,descritors,locs] = sift('image's path');
% showkeys(image,locs);
% 如果你的图像是彩色的,则可以再进行一次读入
% img = imread('image's path');
% showkeys(image,locs);
function showkeys(image, locs)

disp('Drawing SIFT keypoints ...');

% Draw image with keypoints
% 下面这是对出来的figure进行一些参数输入,这个不重要
figure('Position', [50 50 size(image,2) size(image,1)]);
colormap('gray');
imagesc(image);
hold on;
imsize = size(image);
% 画出每一个坐标,还记得前面说的locs是四维向量,前两个是横纵坐标,
% 第三个是尺度,第四个是方向,ok,那么就可以画出来了哟。
for i = 1: size(locs,1)
    % Draw an arrow, each line transformed according to keypoint parameters.
    % 这里的Transform函数在后面定义,知道为什么一个点要画三次么,
    % 因为它要画一个箭头,即------>这样是需要画3条线
    TransformLine(imsize, locs(i,:), 0.0, 0.0, 1.0, 0.0);
    TransformLine(imsize, locs(i,:), 0.85, 0.1, 1.0, 0.0);
    TransformLine(imsize, locs(i,:), 0.85, -0.1, 1.0, 0.0);
end
hold off;


% ------ Subroutine: TransformLine -------
% Draw the given line in the image, but first translate, rotate, and
% scale according to the keypoint parameters.
%
% Parameters:
%   Arrays:
%    imsize = [rows columns] of image
%    keypoint = [subpixel_row subpixel_column scale orientation]
%
%   Scalars:
%    x1, y1; begining of vector
%    x2, y2; ending of vector

% 给出的
function TransformLine(imsize, keypoint, x1, y1, x2, y2)

% The scaling of the unit length arrow is set to approximately the radius
%   of the region used to compute the keypoint descriptor.
% 长度放大6倍
len = 6* keypoint(3);

% Rotate the keypoints by 'ori' = keypoint(4)
s = sin(keypoint(4));
c = cos(keypoint(4));

% Apply transform

%画一条线需要起点和终点,两个点所以搞出四个坐标
r1 = keypoint(1) - len * (c * y1 + s * x1);
c1 = keypoint(2) + len * (- s * y1 + c * x1);
r2 = keypoint(1) - len * (c * y2 + s * x2);
c2 = keypoint(2) + len * (- s * y2 + c * x2);

line([c1 c2], [r1 r2], 'Color', 'c');
blending.m就是把两张图片在同一个figure中展示,这个就不需要过多解释了。
第一篇博文,水是水了点,慢慢会改善。希望学习CV的博友多加好友,共同学习。
