JS数据可视化实验报告——平行坐标、散点图矩阵、点线链接式(javascript)
接上一篇博客的课程实验报告
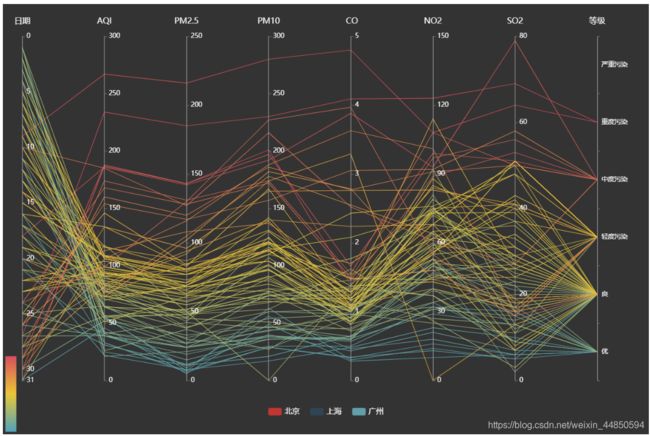
1.平行坐标图
html
<html>
<head>
    <meta charset="UTF-8">
    <title>平行坐标图title>

    <script src="https://cdn.staticfile.org/echarts/4.3.0/echarts.min.js">script>
head>
<body>
    <div id="main" style="width: 1200px;height:800px">div>
    <script src="./平行坐标.js">script>
body>
html>
js
var myChart = echarts.init(document.getElementById('main'));

//引入数据——北京
var dataBJ = [
    [1,55,9,56,0.46,18,6,"良"],
    [2,25,11,21,0.65,34,9,"优"],
    [3,56,7,63,0.3,14,5,"良"],
    [4,33,7,29,0.33,16,6,"优"],
    [5,42,24,44,0.76,40,16,"优"],
    [6,82,58,90,1.77,68,33,"良"],
    [7,74,49,77,1.46,48,27,"良"],
    [8,78,55,80,1.29,59,29,"良"],
    [9,267,216,280,4.8,108,64,"重度污染"],
    [10,185,127,216,2.52,61,27,"中度污染"],
    [11,39,19,38,0.57,31,15,"优"],
    [12,41,11,40,0.43,21,7,"优"],
    [13,64,38,74,1.04,46,22,"良"],
    [14,108,79,120,1.7,75,41,"轻度污染"],
    [15,108,63,116,1.48,44,26,"轻度污染"],
    [16,33,6,29,0.34,13,5,"优"],
    [17,94,66,110,1.54,62,31,"良"],
    [18,186,142,192,3.88,93,79,"中度污染"],
    [19,57,31,54,0.96,32,14,"良"],
    [20,22,8,17,0.48,23,10,"优"],
    [21,39,15,36,0.61,29,13,"优"],
    [22,94,69,114,2.08,73,39,"良"],
    [23,99,73,110,2.43,76,48,"良"],
    [24,31,12,30,0.5,32,16,"优"],
    [25,42,27,43,1,53,22,"优"],
    [26,154,117,157,3.05,92,58,"中度污染"],
    [27,234,185,230,4.09,123,69,"重度污染"],
    [28,160,120,186,2.77,91,50,"中度污染"],
    [29,134,96,165,2.76,83,41,"轻度污染"],
    [30,52,24,60,1.03,50,21,"良"],
    [31,46,5,49,0.28,10,6,"优"]
];

//引入数据——广州
var dataGZ = [
    [1,26,37,27,1.163,27,13,"优"],
    [2,85,62,71,1.195,60,8,"良"],
    [3,78,38,74,1.363,37,7,"良"],
    [4,21,21,36,0.634,40,9,"优"],
    [5,41,42,46,0.915,81,13,"优"],
    [6,56,52,69,1.067,92,16,"良"],
    [7,64,30,28,0.924,51,2,"良"],
    [8,55,48,74,1.236,75,26,"良"],
    [9,76,85,113,1.237,114,27,"良"],
    [10,91,81,104,1.041,56,40,"良"],
    [11,84,39,60,0.964,25,11,"良"],
    [12,64,51,101,0.862,58,23,"良"],
    [13,70,69,120,1.198,65,36,"良"],
    [14,77,105,178,2.549,64,16,"良"],
    [15,109,68,87,0.996,74,29,"轻度污染"],
    [16,73,68,97,0.905,51,34,"良"],
    [17,54,27,47,0.592,53,12,"良"],
    [18,51,61,97,0.811,65,19,"良"],
    [19,91,71,121,1.374,43,18,"良"],
    [20,73,102,182,2.787,44,19,"良"],
    [21,73,50,76,0.717,31,20,"良"],
    [22,84,94,140,2.238,68,18,"良"],
    [23,93,77,104,1.165,53,7,"良"],
    [24,99,130,227,3.97,55,15,"良"],
    [25,146,84,139,1.094,40,17,"轻度污染"],
    [26,113,108,137,1.481,48,15,"轻度污染"],
    [27,81,48,62,1.619,26,3,"良"],
    [28,56,48,68,1.336,37,9,"良"],
    [29,82,92,174,3.29,0,13,"良"],
    [30,106,116,188,3.628,101,16,"轻度污染"],
    [31,118,50,0,1.383,76,11,"轻度污染"]
];

//引入数据——上海
var dataSH = [
    [1,91,45,125,0.82,34,23,"良"],
    [2,65,27,78,0.86,45,29,"良"],
    [3,83,60,84,1.09,73,27,"良"],
    [4,109,81,121,1.28,68,51,"轻度污染"],
    [5,106,77,114,1.07,55,51,"轻度污染"],
    [6,109,81,121,1.28,68,51,"轻度污染"],
    [7,106,77,114,1.07,55,51,"轻度污染"],
    [8,89,65,78,0.86,51,26,"良"],
    [9,53,33,47,0.64,50,17,"良"],
    [10,80,55,80,1.01,75,24,"良"],
    [11,117,81,124,1.03,45,24,"轻度污染"],
    [12,99,71,142,1.1,62,42,"良"],
    [13,95,69,130,1.28,74,50,"良"],
    [14,116,87,131,1.47,84,40,"轻度污染"],
    [15,108,80,121,1.3,85,37,"轻度污染"],
    [16,134,83,167,1.16,57,43,"轻度污染"],
    [17,79,43,107,1.05,59,37,"良"],
    [18,71,46,89,0.86,64,25,"良"],
    [19,97,71,113,1.17,88,31,"良"],
    [20,84,57,91,0.85,55,31,"良"],
    [21,87,63,101,0.9,56,41,"良"],
    [22,104,77,119,1.09,73,48,"轻度污染"],
    [23,87,62,100,1,72,28,"良"],
    [24,168,128,172,1.49,97,56,"中度污染"],
    [25,65,45,51,0.74,39,17,"良"],
    [26,39,24,38,0.61,47,17,"优"],
    [27,39,24,39,0.59,50,19,"优"],
    [28,93,68,96,1.05,79,29,"良"],
    [29,188,143,197,1.66,99,51,"中度污染"],
    [30,174,131,174,1.55,108,50,"中度污染"],
    [31,187,143,201,1.39,89,53,"中度污染"]
];

//定义每列的列名
var schema = [
    {
     name: 'date', index: 0, text: '日期'},
    {
     name: 'AQIindex', index: 1, text: 'AQI'},
    {
     name: 'PM25', index: 2, text: 'PM2.5'},
    {
     name: 'PM10', index: 3, text: 'PM10'},
    {
     name: 'CO', index: 4, text: ' CO'},
    {
     name: 'NO2', index: 5, text: 'NO2'},
    {
     name: 'SO2', index: 6, text: 'SO2'},
    {
     name: '等级', index: 7, text: '等级'}
];

//定义线条类型
var lineStyle = {

    normal: {

        width: 1,
        opacity: 1
    }
};

//定义标签
option = {

    backgroundColor: '#333',
    legend: {

        bottom: 30,
        data: ['北京', '上海', '广州'],
        itemGap: 20,
        textStyle: {

            color: '#fff',
            fontSize: 14
        }
    },
    tooltip: {

        padding: 10,
        backgroundColor: '#222',
        borderColor: '#777',
        borderWidth: 1,
        formatter: function (obj) {

            var value = obj[0].value;
            return ''
                + obj[0].seriesName + ' ' + value[0] + '日期:'
                + value[7]
                + ''
                + schema[1].text + ':' + value[1] + '
'
                + schema[2].text + ':' + value[2] + '
'
                + schema[3].text + ':' + value[3] + '
'
                + schema[4].text + ':' + value[4] + '
'
                + schema[5].text + ':' + value[5] + '
'
                + schema[6].text + ':' + value[6] + '
';
        }
    },

    parallelAxis: [
        {
     dim: 0, name: schema[0].text, inverse: true, max: 31, nameLocation: 'start'},
        {
     dim: 1, name: schema[1].text},
        {
     dim: 2, name: schema[2].text},
        {
     dim: 3, name: schema[3].text},
        {
     dim: 4, name: schema[4].text},
        {
     dim: 5, name: schema[5].text},
        {
     dim: 6, name: schema[6].text},
        {
     dim: 7, name: schema[7].text,
        type: 'category', data: ['优', '良', '轻度污染', '中度污染', '重度污染', '严重污染']}
    ],
    visualMap: {

        show: true,
        min: 0,
        max: 150,
        dimension: 2,
        inRange: {

            color: ['#d94e5d','#eac736','#50a3ba'].reverse(),
        }
    },
    parallel: {

        left: '3%',
        right: '8%',
        bottom: 100,
        parallelAxisDefault: {

            type: 'value',
            name: 'AQI指数',
            nameLocation: 'end',
            nameGap: 20,
            nameTextStyle: {

                color: '#fff',
                fontSize: 15
            },
            axisLine: {

                lineStyle: {

                    color: '#aaa'
                }
            },
            axisTick: {

                lineStyle: {

                    color: '#777'
                }
            },
            splitLine: {

                show: false
            },
            axisLabel: {

                color: '#fff'
            }
        }
    },
    series: [
        {

            name: '北京',
            type: 'parallel',
            lineStyle: lineStyle,
            data: dataBJ
        },
        {

            name: '上海',
            type: 'parallel',
            lineStyle: lineStyle,
            data: dataSH
        },
        {

            name: '广州',
            type: 'parallel',
            lineStyle: lineStyle,
            data: dataGZ
        }
    ]
};

myChart.setOption(option);
2.散点图矩阵
效果图
html
<html>
<head>
    <meta charset="utf-8">
    <title>散点图矩阵title>

    <script src="https://cdn.staticfile.org/echarts/4.3.0/echarts.min.js">script>
head>
<body>
    <div id="main" style="width: 1000px;height:1000px;">div>
    <script src="./散点图矩阵.js">script>
body>
html>
js
var myChart = echarts.init(document.getElementById('main'));
//导入数据
var rawData = [
    [55,9,56,0.46,18,6,"良", "北京"],
    [25,11,21,0.65,34,9,"优", "北京"],
    [56,7,63,0.3,14,5,"良", "北京"],
    [33,7,29,0.33,16,6,"优", "北京"],
    [42,24,44,0.76,40,16,"优", "北京"],
    [82,58,90,1.77,68,33,"良", "北京"],
    [74,49,77,1.46,48,27,"良", "北京"],
    [78,55,80,1.29,59,29,"良", "北京"],
    [267,216,280,4.8,108,64,"重度", "北京"],
    [185,127,216,2.52,61,27,"中度", "北京"],
    [39,19,38,0.57,31,15,"优", "北京"],
    [41,11,40,0.43,21,7,"优", "北京"],
    [64,38,74,1.04,46,22,"良", "北京"],
    [108,79,120,1.7,75,41,"轻度", "北京"],
    [108,63,116,1.48,44,26,"轻度", "北京"],
    [33,6,29,0.34,13,5,"优", "北京"],
    [94,66,110,1.54,62,31,"良", "北京"],
    [186,142,192,3.88,93,79,"中度", "北京"],
    [57,31,54,0.96,32,14,"良", "北京"],
    [22,8,17,0.48,23,10,"优", "北京"],
    [39,15,36,0.61,29,13,"优", "北京"],
    [94,69,114,2.08,73,39,"良", "北京"],
    [99,73,110,2.43,76,48,"良", "北京"],
    [31,12,30,0.5,32,16,"优", "北京"],
    [42,27,43,1,53,22,"优", "北京"],
    [154,117,157,3.05,92,58,"中度", "北京"],
    [234,185,230,4.09,123,69,"重度", "北京"],
    [160,120,186,2.77,91,50,"中度", "北京"],
    [134,96,165,2.76,83,41,"轻度", "北京"],
    [52,24,60,1.03,50,21,"良", "北京"],
    [46,5,49,0.28,10,6,"优", "北京"],

    [26,37,27,1.163,27,13,"优", "广州"],
    [85,62,71,1.195,60,8,"良", "广州"],
    [78,38,74,1.363,37,7,"良", "广州"],
    [21,21,36,0.634,40,9,"优", "广州"],
    [41,42,46,0.915,81,13,"优", "广州"],
    [56,52,69,1.067,92,16,"良", "广州"],
    [64,30,28,0.924,51,2,"良", "广州"],
    [55,48,74,1.236,75,26,"良", "广州"],
    [76,85,113,1.237,114,27,"良", "广州"],
    [91,81,104,1.041,56,40,"良", "广州"],
    [84,39,60,0.964,25,11,"良", "广州"],
    [64,51,101,0.862,58,23,"良", "广州"],
    [70,69,120,1.198,65,36,"良", "广州"],
    [77,105,178,2.549,64,16,"良", "广州"],
    [109,68,87,0.996,74,29,"轻度", "广州"],
    [73,68,97,0.905,51,34,"良", "广州"],
    [54,27,47,0.592,53,12,"良", "广州"],
    [51,61,97,0.811,65,19,"良", "广州"],
    [91,71,121,1.374,43,18,"良", "广州"],
    [73,102,182,2.787,44,19,"良", "广州"],
    [73,50,76,0.717,31,20,"良", "广州"],
    [84,94,140,2.238,68,18,"良", "广州"],
    [93,77,104,1.165,53,7,"良", "广州"],
    [99,130,227,3.97,55,15,"良", "广州"],
    [146,84,139,1.094,40,17,"轻度", "广州"],
    [113,108,137,1.481,48,15,"轻度", "广州"],
    [81,48,62,1.619,26,3,"良", "广州"],
    [56,48,68,1.336,37,9,"良", "广州"],
    [82,92,174,3.29,0,13,"良", "广州"],
    [106,116,188,3.628,101,16,"轻度", "广州"],
    [118,50,0,1.383,76,11,"轻度", "广州"],

    [91,45,125,0.82,34,23,"良", "上海"],
    [65,27,78,0.86,45,29,"良", "上海"],
    [83,60,84,1.09,73,27,"良", "上海"],
    [109,81,121,1.28,68,51,"轻度", "上海"],
    [106,77,114,1.07,55,51,"轻度", "上海"],
    [109,81,121,1.28,68,51,"轻度", "上海"],
    [106,77,114,1.07,55,51,"轻度", "上海"],
    [89,65,78,0.86,51,26,"良", "上海"],
    [53,33,47,0.64,50,17,"良", "上海"],
    [80,55,80,1.01,75,24,"良", "上海"],
    [117,81,124,1.03,45,24,"轻度", "上海"],
    [99,71,142,1.1,62,42,"良", "上海"],
    [95,69,130,1.28,74,50,"良", "上海"],
    [116,87,131,1.47,84,40,"轻度", "上海"],
    [108,80,121,1.3,85,37,"轻度", "上海"],
    [134,83,167,1.16,57,43,"轻度", "上海"],
    [79,43,107,1.05,59,37,"良", "上海"],
    [71,46,89,0.86,64,25,"良", "上海"],
    [97,71,113,1.17,88,31,"良", "上海"],
    [84,57,91,0.85,55,31,"良", "上海"],
    [87,63,101,0.9,56,41,"良", "上海"],
    [104,77,119,1.09,73,48,"轻度", "上海"],
    [87,62,100,1,72,28,"良", "上海"],
    [168,128,172,1.49,97,56,"中度", "上海"],
    [65,45,51,0.74,39,17,"良", "上海"],
    [39,24,38,0.61,47,17,"优", "上海"],
    [39,24,39,0.59,50,19,"优", "上海"],
    [93,68,96,1.05,79,29,"良", "上海"],
    [188,143,197,1.66,99,51,"中度", "上海"],
    [174,131,174,1.55,108,50,"中度", "上海"],
    [187,143,201,1.39,89,53,"中度", "上海"]
];

//定义每行每列间隙大小
var CATEGORY_DIM_COUNT = 6;
var GAP = 3;
var BASE_LEFT = 5;
var BASE_TOP = 10;
//定义图表位置
var GRID_WIDTH = (100 - BASE_LEFT - GAP) / CATEGORY_DIM_COUNT - GAP;
var GRID_HEIGHT = (100 - BASE_TOP - GAP) / CATEGORY_DIM_COUNT - GAP;
//定义散点图矩阵中的点的带下
var CATEGORY_DIM = 7;
var SYMBOL_SIZE = 3;

function retrieveScatterData(data, dimX, dimY) {

    var result = [];
    for (var i = 0; i < data.length; i++) {

        var item = [data[i][dimX], data[i][dimY]];
        item[CATEGORY_DIM] = data[i][CATEGORY_DIM];
        result.push(item);
    }
    return result;
}

function generateGrids(option) {

    var index = 0;

    for (var i = 0; i < CATEGORY_DIM_COUNT; i++) {

        for (var j = 0; j < CATEGORY_DIM_COUNT; j++) {

            if (CATEGORY_DIM_COUNT - i >= CATEGORY_DIM_COUNT+1) {

                continue;
            }

            option.grid.push({

                left: BASE_LEFT + i * (GRID_WIDTH + GAP) + '%',
                top: BASE_TOP + j * (GRID_HEIGHT + GAP) + '%',
                width: GRID_WIDTH + '%',
                height: GRID_HEIGHT + '%'
            });

            option.brush.xAxisIndex && option.brush.xAxisIndex.push(index);
            option.brush.yAxisIndex && option.brush.yAxisIndex.push(index);

            option.xAxis.push({

                splitNumber: 3,
                position: 'top',
                axisLine: {

                    show: j === 0,
                    onZero: false
                },
                axisTick: {

                    show: j === 0,
                    inside: true
                },
                axisLabel: {

                    show: j === 0
                },
                type: 'value',
                gridIndex: index,
                scale: true
            });

            option.yAxis.push({

                splitNumber: 3,
                position: 'right',
                axisLine: {

                    show: i === CATEGORY_DIM_COUNT - 1,
                    onZero: false
                },
                axisTick: {

                    show: i === CATEGORY_DIM_COUNT - 1,
                    inside: true
                },
                axisLabel: {

                    show: i === CATEGORY_DIM_COUNT - 1
                },
                type: 'value',
                gridIndex: index,
                scale: true
            });

            option.series.push({

                type: 'scatter',
                symbolSize: SYMBOL_SIZE,
                xAxisIndex: index,
                yAxisIndex: index,
                data: retrieveScatterData(rawData, i, j)
            });

            option.visualMap.seriesIndex.push(option.series.length - 1);

            index++;
        }
    }
}


var option = {

    animation: false,
    brush: {

        brushLink: 'all',
        xAxisIndex: [],
        yAxisIndex: [],
        inBrush: {

            opacity: 1
        }
    },
    visualMap: {

        type: 'piecewise',
        categories: ["北京", "上海", "广州"],
        dimension: CATEGORY_DIM,
        orient: 'horizontal',
        top: 10,
        left: 'center',
        inRange: {

            color: ['#c23531','#2f4554', '#61a0a8']
        },
        outOfRange: {

            color: '#ddd'
        },
        seriesIndex: [0]
    },
    tooltip: {

        trigger: 'item'
    },

    parallel: {

        bottom: '10%',
        left: '5%',
        height: '31%',
        width: '55%',
        parallelAxisDefault: {

            type: 'value',
            name: 'AQI指数',
            nameLocation: 'end',
            nameGap: 20,
            splitNumber: 3,
            nameTextStyle: {

                fontSize: 14
            },
            axisLine: {

                lineStyle: {

                    color: '#555'
                }
            },
            axisTick: {

                lineStyle: {

                    color: '#555'
                }
            },
            splitLine: {

                show: false
            },
            axisLabel: {

                color: '#555'
            }
        }
    },
    grid: [],
    xAxis: [],
    yAxis: [],
    series: [
        {

            name: 'parallel',
            type: 'parallel',
            smooth: true,
            lineStyle: {

                width: 40,
                opacity: 0.3
            },
            data: rawData
        }
    ]
};

generateGrids(option);

myChart.setOption(option);
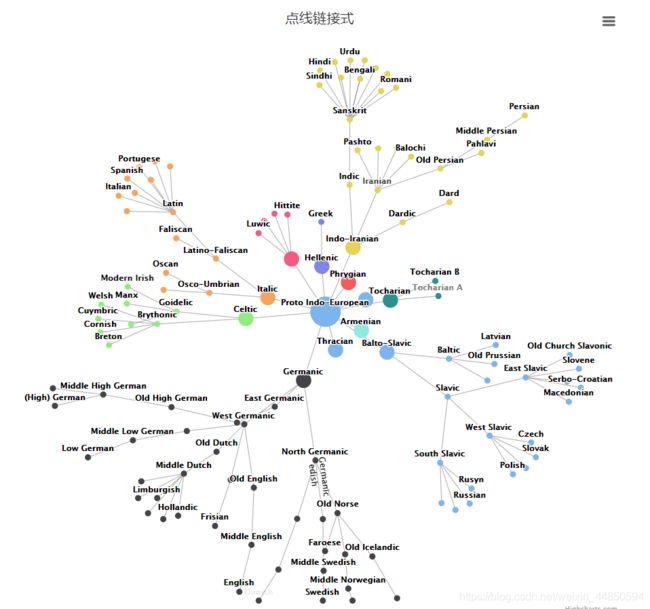
3.点线链接式
效果图
html
<html>
    <head>
        <title>点线链接式title>
        <meta charset="utf-8">	<meta name="viewport" content="width=device-width, initial-scale=1">
        <meta http-equiv="x-ua-compatible" content="ie=edge">
        <link rel="icon" href="https://static.jianshukeji.com/hcode/images/favicon.ico">
        <style>
            #container {

	            min-width: 400px;
                max-width: 800px;
                margin: 0 auto;
            }
        style>
        <script src="https://code.highcharts.com.cn/highcharts/highcharts.js">script>
        <script src="https://code.highcharts.com.cn/highcharts/modules/exporting.js">script>
        <script src="https://code.highcharts.com.cn/highcharts/modules/oldie.js">script>
        <script src="https://code.highcharts.com.cn/highcharts/modules/networkgraph.js">script>
    head>
    <body>
        <div id="container">div>
        <script src="./点线链接式.js">script>
    body>
html>
js
Highcharts.addEvent(
	Highcharts.seriesTypes.networkgraph,
	'afterSetOptions',
	function (e) {

		var colors = Highcharts.getOptions().colors,
			i = 0,
			nodes = {
     };
		e.options.data.forEach(function (link) {

			if (link[0] === 'Proto Indo-European') {

				nodes['Proto Indo-European'] = {

					id: 'Proto Indo-European',
					marker: {

						radius: 20
					}
				};
				nodes[link[1]] = {

					id: link[1],
					marker: {

						radius: 10
					},
					color: colors[i++]
				};
			} else if (nodes[link[0]] && nodes[link[0]].color) {

				nodes[link[1]] = {

					id: link[1],
					color: nodes[link[0]].color
				};
			}
		});
		e.options.nodes = Object.keys(nodes).map(function (id) {

			return nodes[id];
		});
	}
);
Highcharts.chart('container', {

	chart: {

		type: 'networkgraph',
		height: '100%'
	},
	title: {

		text: '点线链接式'
	},
	plotOptions: {

		networkgraph: {

			keys: ['from', 'to'],
			layoutAlgorithm: {

				enableSimulation: true
			}
		}
	},
	series: [{

		dataLabels: {

			enabled: true
		},
		data: [
			['Proto Indo-European', 'Balto-Slavic'],
			['Proto Indo-European', 'Germanic'],
			['Proto Indo-European', 'Celtic'],
			['Proto Indo-European', 'Italic'],
			['Proto Indo-European', 'Hellenic'],
			['Proto Indo-European', 'Anatolian'],
			['Proto Indo-European', 'Indo-Iranian'],
			['Proto Indo-European', 'Tocharian'],
			['Indo-Iranian', 'Dardic'],
			['Indo-Iranian', 'Indic'],
			['Indo-Iranian', 'Iranian'],
			['Iranian', 'Old Persian'],
			['Old Persian', 'Middle Persian'],
			['Indic', 'Sanskrit'],
			['Italic', 'Osco-Umbrian'],
			['Italic', 'Latino-Faliscan'],
			['Latino-Faliscan', 'Latin'],
			['Celtic', 'Brythonic'],
			['Celtic', 'Goidelic'],
			['Germanic', 'North Germanic'],
			['Germanic', 'West Germanic'],
			['Germanic', 'East Germanic'],
			['North Germanic', 'Old Norse'],
			['North Germanic', 'Old Swedish'],
			['North Germanic', 'Old Danish'],
			['West Germanic', 'Old English'],
			['West Germanic', 'Old Frisian'],
			['West Germanic', 'Old Dutch'],
			['West Germanic', 'Old Low German'],
			['West Germanic', 'Old High German'],
			['Old Norse', 'Old Icelandic'],
			['Old Norse', 'Old Norwegian'],
			['Old Norwegian', 'Middle Norwegian'],
			['Old Swedish', 'Middle Swedish'],
			['Old Danish', 'Middle Danish'],
			['Old English', 'Middle English'],
			['Old Dutch', 'Middle Dutch'],
			['Old Low German', 'Middle Low German'],
			['Old High German', 'Middle High German'],
			['Balto-Slavic', 'Baltic'],
			['Balto-Slavic', 'Slavic'],
			['Slavic', 'East Slavic'],
			['Slavic', 'West Slavic'],
			['Slavic', 'South Slavic'],
			['Proto Indo-European', 'Phrygian'],
			['Proto Indo-European', 'Armenian'],
			['Proto Indo-European', 'Albanian'],
			['Proto Indo-European', 'Thracian'],
			['Tocharian', 'Tocharian A'],
			['Tocharian', 'Tocharian B'],
			['Anatolian', 'Hittite'],
			['Anatolian', 'Palaic'],
			['Anatolian', 'Luwic'],
			['Anatolian', 'Lydian'],
			['Iranian', 'Balochi'],
			['Iranian', 'Kurdish'],
			['Iranian', 'Pashto'],
			['Iranian', 'Sogdian'],
			['Old Persian', 'Pahlavi'],
			['Middle Persian', 'Persian'],
			['Hellenic', 'Greek'],
			['Dardic', 'Dard'],
			['Sanskrit', 'Sindhi'],
			['Sanskrit', 'Romani'],
			['Sanskrit', 'Urdu'],
			['Sanskrit', 'Hindi'],
			['Sanskrit', 'Bihari'],
			['Sanskrit', 'Assamese'],
			['Sanskrit', 'Bengali'],
			['Sanskrit', 'Marathi'],
			['Sanskrit', 'Gujarati'],
			['Sanskrit', 'Punjabi'],
			['Sanskrit', 'Sinhalese'],
			['Osco-Umbrian', 'Umbrian'],
			['Osco-Umbrian', 'Oscan'],
			['Latino-Faliscan', 'Faliscan'],
			['Latin', 'Portugese'],
			['Latin', 'Spanish'],
			['Latin', 'French'],
			['Latin', 'Romanian'],
			['Latin', 'Italian'],
			['Latin', 'Catalan'],
			['Latin', 'Franco-Provençal'],
			['Latin', 'Rhaeto-Romance'],
			['Brythonic', 'Welsh'],
			['Brythonic', 'Breton'],
			['Brythonic', 'Cornish'],
			['Brythonic', 'Cuymbric'],
			['Goidelic', 'Modern Irish'],
			['Goidelic', 'Scottish Gaelic'],
			['Goidelic', 'Manx'],
			['East Germanic', 'Gothic'],
			['Middle Low German', 'Low German'],
			['Middle High German', '(High) German'],
			['Middle High German', 'Yiddish'],
			['Middle English', 'English'],
			['Middle Dutch', 'Hollandic'],
			['Middle Dutch', 'Flemish'],
			['Middle Dutch', 'Dutch'],
			['Middle Dutch', 'Limburgish'],
			['Middle Dutch', 'Brabantian'],
			['Middle Dutch', 'Rhinelandic'],
			['Old Frisian', 'Frisian'],
			['Middle Danish', 'Danish'],
			['Middle Swedish', 'Swedish'],
			['Middle Norwegian', 'Norwegian'],
			['Old Norse', 'Faroese'],
			['Old Icelandic', 'Icelandic'],
			['Baltic', 'Old Prussian'],
			['Baltic', 'Lithuanian'],
			['Baltic', 'Latvian'],
			['West Slavic', 'Polish'],
			['West Slavic', 'Slovak'],
			['West Slavic', 'Czech'],
			['West Slavic', 'Wendish'],
			['East Slavic', 'Bulgarian'],
			['East Slavic', 'Old Church Slavonic'],
			['East Slavic', 'Macedonian'],
			['East Slavic', 'Serbo-Croatian'],
			['East Slavic', 'Slovene'],
			['South Slavic', 'Russian'],
			['South Slavic', 'Ukrainian'],
			['South Slavic', 'Belarusian'],
			['South Slavic', 'Rusyn']
		]
	}]
});
**我的分享就结束啦~
如果代码部分有什么问题,可以评论区留言~**


