深入浅出 Javascript API(四)--绘制 Graphics
作者:Flyingis
本文严禁擅自转载或用于商业目的,如有需要请事先联系作者:dev.vip#gmail.com
Graphics绘制是webgis基本编辑功能之一,基于Javascript API进行开发很容易联想到其基础功能的提供者--Dojo,point、multipoint、polyline、polygon等基本图形可以很方便的在地图上绘制出来,效果还不错!这里需要引入一个新的库"esri.toolbars.draw"。
Toolbar并不是一个用户接口组件,而是一个Helper类用于在地图上绘制图形,通常由客户端的UI组件来触发所要绘制的具体图形,如通过按钮触发:
用户绘制完成后,将触发事件来完成具体图形的显示:
 dojo.connect(tb,
"
onDrawEnd
"
, addGraphic);
了解AO和Ags ADF的开发人员都知道,图形一般由两部分组成,一是所要绘制的几何图形,即geometry,一是绘制图形的显示效果,如SimpleMarkerSymbol,所以在addGraphic方法要完成这两部分的赋值:
 function
addGraphic(geometry)
{
 var symbol = dojo.byId("symbol").value;
 if (symbol) {
 symbol = eval(symbol);
 }
} else {
 var type = geometry.type;
 if (type === "point" || type === "multipoint") {
 symbol = tb.markerSymbol;
 }
} else if (type === "line" || type === "polyline") {
 symbol = tb.lineSymbol;
 }
} else {
 symbol = tb.fillSymbol;
 }
} }
} map.graphics.add(new esri.Graphic(geometry, symbol));
 }
}
内容目录:
1.各种基本图形绘制
2.选择点要素并以Graphics方式高亮显示
1.在上文对Graphics绘制功能编写基础上,以官方网站上的代码为例,在客户端提供多种基础形状的绘制功能,此时Graphics形状由用户客户端通过toolbar提供的helper方法决定,绘制的显示效果通过一个DropDownList进行选择:
<option value="new esri.symbol.SimpleMarkerSymbol(esri.symbol.SimpleMarkerSymbol.STYLE_SQUARE, 10, new esri.symbol.SimpleLineSymbol(esri.symbol.SimpleLineSymbol.STYLE_SOLID, new dojo.Color([255,0,0]), 1), new dojo.Color([0,255,0,0.25]))">Square</option>
Toolbar初始化及事件监听在map.addLayer之前完成:
 function
init()
{
 map = new esri.Map("map");
 dojo.connect(map, "onLoad", initToolbar);
 map.addLayer(new esri.layers.ArcGISTiledMapServiceLayer("http://server.arcgisonline.com/ArcGIS/rest/services/ESRI_StreetMap_World_2D/MapServer"));
 }
}

 function
initToolbar(map)
{
 tb = new esri.toolbars.Draw(map);
 dojo.connect(tb, "onDrawEnd", addGraphic);
 }
}
构建界面UI之后,可以直接浏览网页,Demo演示地址:
http://resources.esri.com/help/9.3/arcgisserver/apis/javascript/arcgis/demos/Graphics/graphics.html
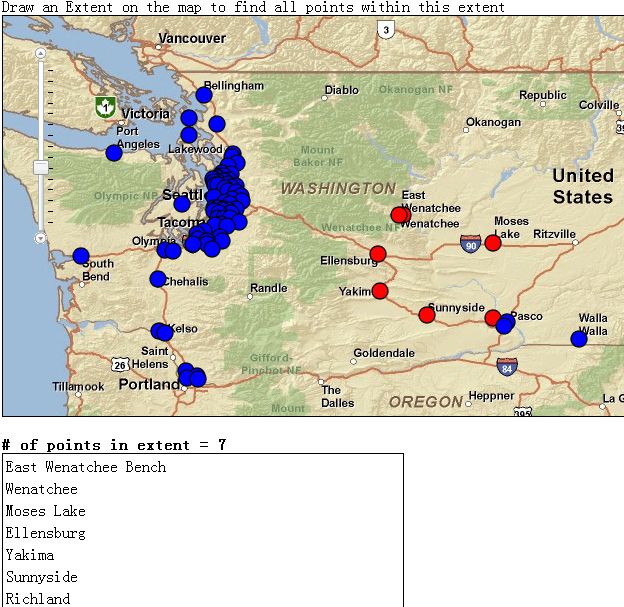
2.框选点要素,在很多行业应用中都涉及到,如对银行POI网点选择,电线杆塔统计,烟草销售点业态分析等等,在Javascript API实现这样的功能,需要分两步实现,第一是框选查询,第二是对查询的结果渲染并以Graphics方式显示。
查询功能在后续文章中会详细介绍,这里仅轻笔带过,引入"esri.tasks.query",查询功能实现:
 var
queryTask
=
new
esri.tasks.QueryTask(
"
http://sampleserver1.arcgisonline.com/ArcGIS/rest/services/Specialty/ESRI_StatesCitiesRivers_USA/MapServer/0
"
);
 var
query
=
new
esri.tasks.Query();
 query.where
=
"
STATE_NAME = 'Washington'
"
;
 query.returnGeometry
=
true
;
 query.outFields
=
[
"
CITY_NAME
"
];
 queryTask.execute(query, addPointsToMap);
上面URL指向的是另外一个REST服务,addPointsToMap将所有符合条件的点都添加到Map中作为Graphics显示,接下来就是要在这些点中框选点并用不同颜色高亮显示。
 function
findPointsInExtent(extent)
{
 var graphics = map.graphics.graphics;
 var results = [];
 var graphic;
 for (var i=0, il=graphics.length; i<il; i++) {
 graphic = graphics[i];
 // 选择框所包含的点用highlightSymbol高亮显示
 if (extent.contains(graphic.geometry)) {
 graphic.setSymbol(highlightSymbol);
 results.push(graphic.getContent());
 }
} // 之前已经highlightSymbol高亮显示的点恢复为原来defaultSymbol显示
 else if (graphic.symbol == highlightSymbol) {
 graphic.setSymbol(defaultSymbol);
 }
} }
} }
}
功能开发就完成了,剩下的就是加上对事件的监听以及客户端UI编辑。
 function
initToolbar(map)
{
 var tb = new esri.toolbars.Draw(map);
 dojo.connect(tb, "onDrawEnd", findPointsInExtent);
 tb.activate(esri.toolbars.Draw.EXTENT);
 }
}


