《Python编程从入门到实践》项目二 01初识matplotlib
数据可视化–生成数据
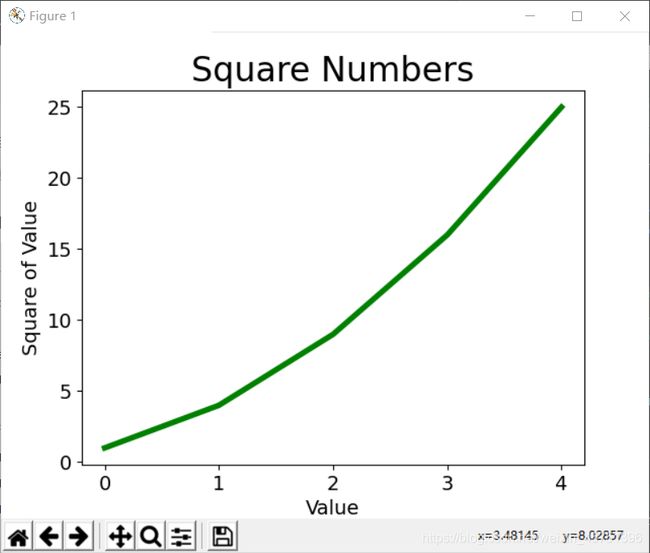
1.绘制简单的折线图并修改标签文字和线条粗细
import matplotlib.pyplot as plt

square = [1, 4, 9, 16, 25]
plt.plot(square, linewidth=4, color="green")

# 设置图表标题,并给坐标轴加上标签
plt.title("Square Numbers", fontsize=24)
plt.xlabel("Value", fontsize=14)
plt.ylabel("Square of Value", fontsize=14)

# 设置刻度标记的大小
plt.tick_params(axis='both', labelsize=14)

plt.show()
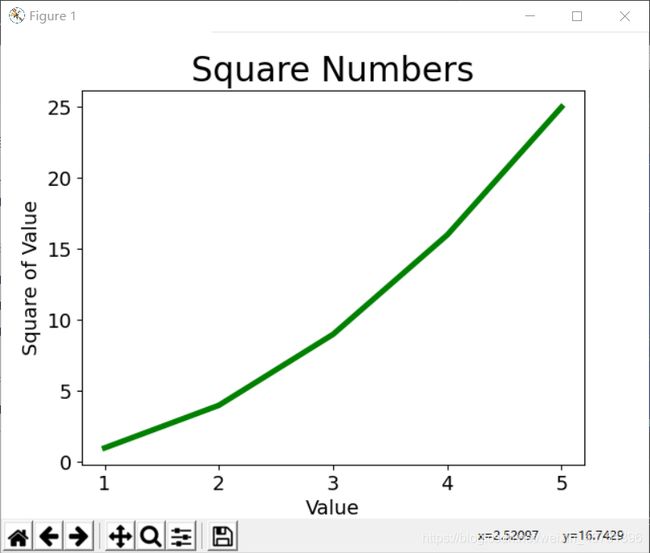
同时给plot(),提供输入值和输出值。
改变其默认第一个数据点对应的X坐标值为0。
import matplotlib.pyplot as plt

input_values = [1, 2, 3, 4, 5]
squares = [1, 4, 9, 16, 25]
plt.plot(input_values, squares, linewidth=4, color="green")

# 设置图表标题,并给坐标轴加上标签
plt.title("Square Numbers", fontsize=24)
plt.xlabel("Value", fontsize=14)
plt.ylabel("Square of Value", fontsize=14)

# 设置刻度标记的大小
plt.tick_params(axis='both', labelsize=14)

plt.show()
#绘制一个点
import matplotlib.pyplot as plt

plt.scatter(2, 4, color="red")

# 设置图表标题,并给坐标轴加上标签
plt.title("Square Numbers", fontsize=24)
plt.xlabel("Value", fontsize=14)
plt.ylabel("Square of Value", fontsize=14)

# 设置刻度标记的大小
plt.tick_params(axis='both', labelsize=14, color="red")

plt.show()

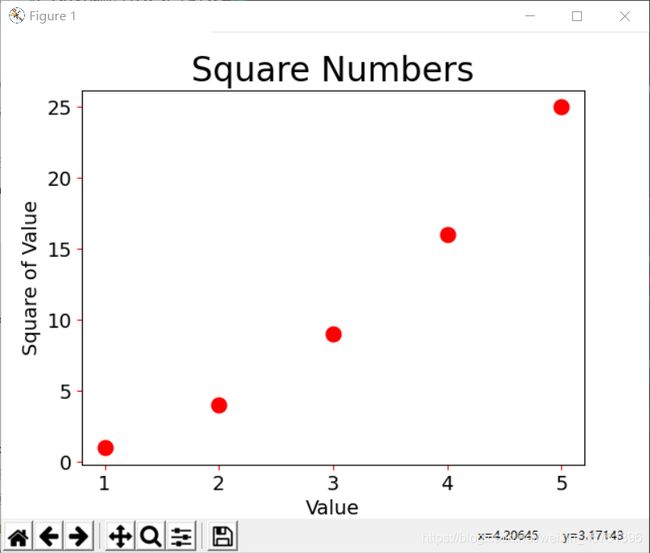
#绘制一系列点
import matplotlib.pyplot as plt

x_value = [1, 2, 3, 4, 5]
y_value = [1, 4, 9, 16, 25]

plt.scatter(x_value, y_value, color="red", s=111)
#s应该是点的直径吧,改变值后点的直径发生变化
# 设置图表标题,并给坐标轴加上标签
plt.title("Square Numbers", fontsize=24)
plt.xlabel("Value", fontsize=14)
plt.ylabel("Square of Value", fontsize=14)

# 设置刻度标记的大小
plt.tick_params(axis='both', labelsize=14, color="red")

plt.show()
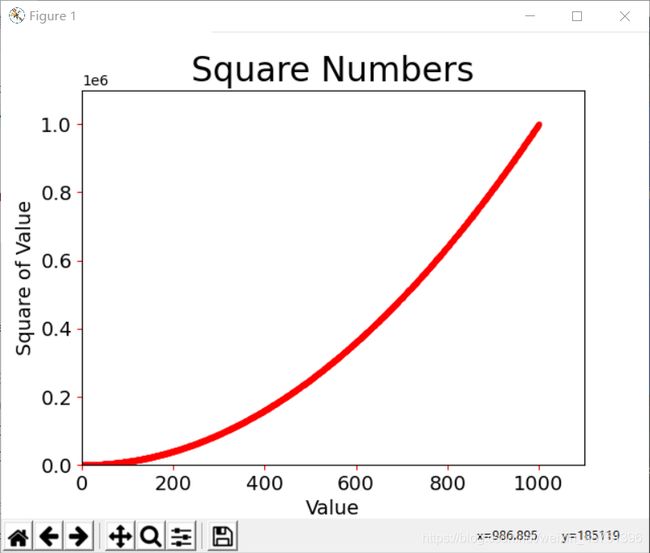
所谓自动计算,就是使用了列表解析的方法。
import matplotlib.pyplot as plt

x_value = list(range(1, 1001))
y_value = [x**2 for x in x_value]

plt.scatter(x_value, y_value, color="red", s=10)

# 设置图表标题,并给坐标轴加上标签
plt.title("Square Numbers", fontsize=24)
plt.xlabel("Value", fontsize=14)
plt.ylabel("Square of Value", fontsize=14)

# 设置刻度标记的大小
plt.tick_params(axis='both', labelsize=14, color="red")

plt.axis([0, 1100, 0, 1100000])

plt.show()
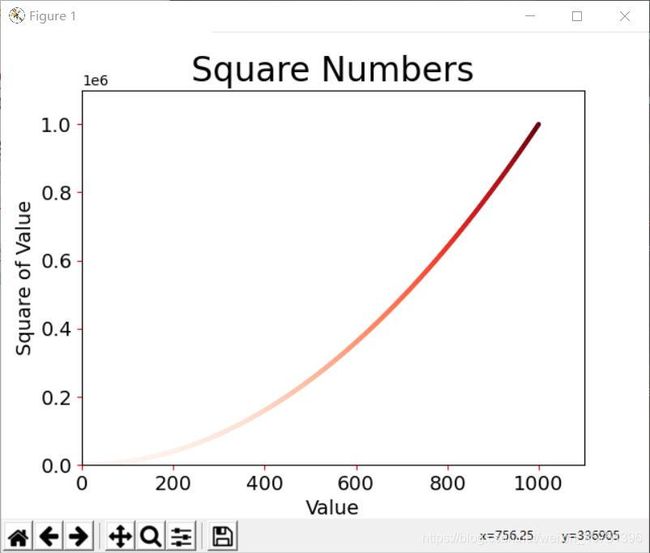
#c=y_value, cmap=plt.cm.Reds,
将参数c设置成一个y值列表,并使用参数cmap告诉pyplot使用哪个颜色映射。
import matplotlib.pyplot as plt

x_value = list(range(1, 1001))
y_value = [x**2 for x in x_value]

plt.scatter(x_value, y_value, c=y_value,
            cmap=plt.cm.Reds, edgecolors='none', s=10)

# 设置图表标题,并给坐标轴加上标签
plt.title("Square Numbers", fontsize=24)
plt.xlabel("Value", fontsize=14)
plt.ylabel("Square of Value", fontsize=14)

# 设置刻度标记的大小
plt.tick_params(axis='both', labelsize=14, color="red")

plt.axis([0, 1100, 0, 1100000])

plt.show()
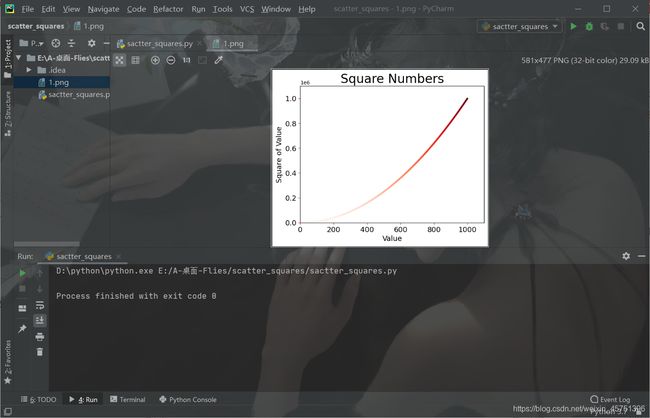
plt.savefig(“1.png”, bbox_inches=‘tight’)
可见xx.png,xx是图片名,默认保存到py文件所在的目录中。
第二个实参指定将图表多余的空白区域裁剪掉,如果要保留周围多余的空白区域可忽略这个实参。
